
- Home >
- Stock Videos >
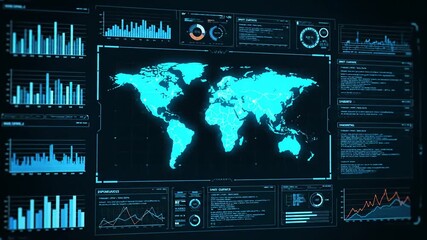
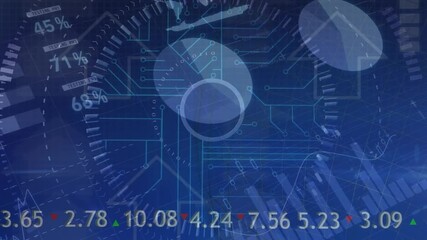
- Global Financial Data Visualization with Animated Graphs
Global Financial Data Visualization with Animated Graphs Video
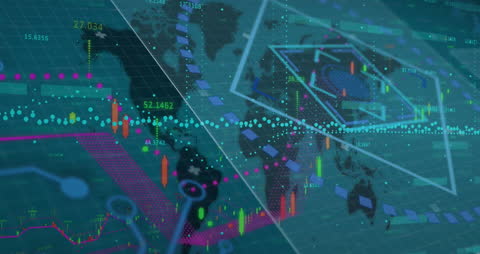
This visual illustrates the interconnectedness of global financial data through animated graphs and a digital interface superimposed over a world map. Helpful for representing concepts in global finance, technological integration in data processing, or showcasing connections in international stock markets. Ideal as a visual aid in financial tech presentations, global economics resources, or networks technology marketing.
Powered by 


downloads
Tags:
More
Credit Photo
If you would like to credit the Photo, here are some ways you can do so
Text Link
video Link
<span class="text-link">
<span>
<a target="_blank" href=https://pikwizard.com/video/global-financial-data-visualization-with-animated-graphs/225aaf41a91284c00f728bf7331540f9/>PikWizard</a>
</span>
</span>
<span class="image-link">
<span
style="margin: 0 0 20px 0; display: inline-block; vertical-align: middle; width: 100%;"
>
<a
target="_blank"
href="https://pikwizard.com/video/global-financial-data-visualization-with-animated-graphs/225aaf41a91284c00f728bf7331540f9/"
style="text-decoration: none; font-size: 10px; margin: 0;"
>
<video controls style="width: 100%; margin: 0;">
<source src="https://player.vimeo.com/progressive_redirect/playback/760189299/rendition/240p/file.mp4?loc=external&oauth2_token_id=1223210874&signature=e9f6751217c84f61464d6bad9416f67fc8d9d7c14b668de3c76c0a0c1360a205" type="video/mp4"
poster="https://pikwizard.com/pw/medium/225aaf41a91284c00f728bf7331540f9.jpg"/>
Your browser does not support the video tag.
</video>
<p style="font-size: 12px; margin: 0;">PikWizard</p>
</a>
</span>
</span>
Free (free of charge)
Free for personal and commercial use.
Author: Awesome Content