
- Home >
- Stock Videos >
- Global Financial Data Visualization with Business Professionals
Global Financial Data Visualization with Business Professionals Video
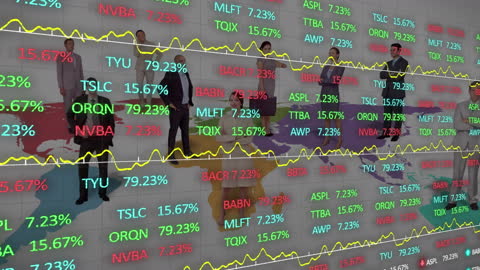
This video showcases an animated presentation of financial data, overlaid on a world map, highlighting international trade and global business dynamics. Featuring diverse business professionals against dynamic stock market graphs, this visual is ideal for illustrating concepts related to the global economy, financial analytics, international commerce, and data-driven business strategies. Suitable for use in presentations, educational materials, and financial reports.
Powered by  - Get 15% off with code: PIKWIZARD15


downloads
Tags:
More
Credit Photo
If you would like to credit the Photo, here are some ways you can do so
Text Link
video Link
<span class="text-link">
<span>
<a target="_blank" href=https://pikwizard.com/video/global-financial-data-visualization-with-business-professionals/c6202906d8d21f308944f937a19549fb/>PikWizard</a>
</span>
</span>
<span class="image-link">
<span
style="margin: 0 0 20px 0; display: inline-block; vertical-align: middle; width: 100%;"
>
<a
target="_blank"
href="https://pikwizard.com/video/global-financial-data-visualization-with-business-professionals/c6202906d8d21f308944f937a19549fb/"
style="text-decoration: none; font-size: 10px; margin: 0;"
>
<video controls style="width: 100%; margin: 0;">
<source src="https://player.vimeo.com/progressive_redirect/playback/774894860/rendition/240p/file.mp4?loc=external&oauth2_token_id=1223210874&signature=8cb56263da64238b37a1d633bf8e9e7b756a30094ea6c85412500b0cb511949d" type="video/mp4"
poster="https://pikwizard.com/pw/medium/c6202906d8d21f308944f937a19549fb.jpg"/>
Your browser does not support the video tag.
</video>
<p style="font-size: 12px; margin: 0;">PikWizard</p>
</a>
</span>
</span>
Free (free of charge)
Free for personal and commercial use.
Author: Awesome Content