
- Home >
- Stock Videos >
- Global Financial Data Visualization with Holographic Graphs
Global Financial Data Visualization with Holographic Graphs Video
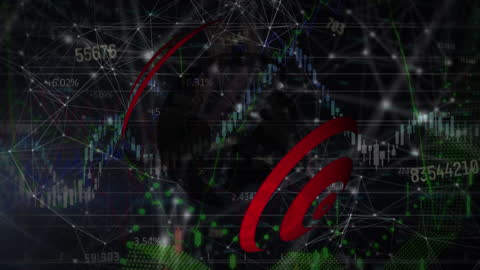
Intricate digital representation of financial data blending holographic graphs and interconnected dots over a world map. Ideal for themes of globalization and economic dynamics, applicable in presentations about financial growth, business analytics, data communication, and network globalization concepts.
Powered by 


downloads
Tags:
More
Credit Photo
If you would like to credit the Photo, here are some ways you can do so
Text Link
video Link
<span class="text-link">
<span>
<a target="_blank" href=https://pikwizard.com/video/global-financial-data-visualization-with-holographic-graphs/d2130e42f8e1096c6f2b0d8dcc7a292f/>PikWizard</a>
</span>
</span>
<span class="image-link">
<span
style="margin: 0 0 20px 0; display: inline-block; vertical-align: middle; width: 100%;"
>
<a
target="_blank"
href="https://pikwizard.com/video/global-financial-data-visualization-with-holographic-graphs/d2130e42f8e1096c6f2b0d8dcc7a292f/"
style="text-decoration: none; font-size: 10px; margin: 0;"
>
<video controls style="width: 100%; margin: 0;">
<source src="https://player.vimeo.com/progressive_redirect/playback/773256096/rendition/240p/file.mp4?loc=external&oauth2_token_id=1223210874&signature=b9f7693e7f377555fa10366a42a214b146c8f87c1266f043a9d9f31d31de0bc1" type="video/mp4"
poster="https://pikwizard.com/pw/medium/d2130e42f8e1096c6f2b0d8dcc7a292f.jpg"/>
Your browser does not support the video tag.
</video>
<p style="font-size: 12px; margin: 0;">PikWizard</p>
</a>
</span>
</span>
Free (free of charge)
Free for personal and commercial use.
Author: Awesome Content