
- Home >
- Stock Videos >
- Global Financial Data Visualization with Interactive Interface
Global Financial Data Visualization with Interactive Interface Video
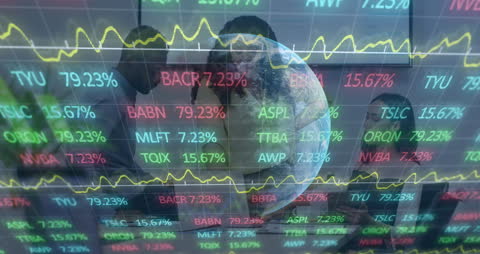
This stock animation features dynamic visualization of global financial data overlaying the planet Earth and world maps with vivid colored graphs and financial indicators. Ideal for use in presentations, corporate videos, and documentaries focusing on international business and economic trends. This animation conveys the concept of connectivity and real-time communication trends in the global stock market economy, suitable for investment seminars and financial tech marketing.

downloads
Tags:
More
Credit Photo
If you would like to credit the Photo, here are some ways you can do so
Text Link
video Link
<span class="text-link">
<span>
<a target="_blank" href=https://pikwizard.com/video/global-financial-data-visualization-with-interactive-interface/64e0b836611fcfe6fe325fc04007da98/>PikWizard</a>
</span>
</span>
<span class="image-link">
<span
style="margin: 0 0 20px 0; display: inline-block; vertical-align: middle; width: 100%;"
>
<a
target="_blank"
href="https://pikwizard.com/video/global-financial-data-visualization-with-interactive-interface/64e0b836611fcfe6fe325fc04007da98/"
style="text-decoration: none; font-size: 10px; margin: 0;"
>
<video controls style="width: 100%; margin: 0;">
<source src="https://player.vimeo.com/progressive_redirect/playback/736371594/rendition/240p/file.mp4?loc=external&oauth2_token_id=1223210874&signature=85ed1a6c589d627aac68979c09860370097bcf036ff5a7751e6e66b9803ec434" type="video/mp4"
poster="https://pikwizard.com/pw/medium/64e0b836611fcfe6fe325fc04007da98.jpg"/>
Your browser does not support the video tag.
</video>
<p style="font-size: 12px; margin: 0;">PikWizard</p>
</a>
</span>
</span>
Free (free of charge)
Free for personal and commercial use.
Author: Awesome Content