
- Home >
- Stock Videos >
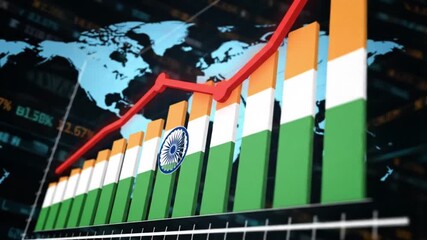
- Global Financial Data Visualization with Red Globe and Graphs
Global Financial Data Visualization with Red Globe and Graphs Video

Graphic representing global financial trends with a focus on economy data visualization. Use this in presentations, economic reports, or as web graphics to illustrate increasing trends and market analysis.
Powered by 


downloads
Tags:
More
Credit Photo
If you would like to credit the Photo, here are some ways you can do so
Text Link
video Link
<span class="text-link">
<span>
<a target="_blank" href=https://pikwizard.com/video/global-financial-data-visualization-with-red-globe-and-graphs/b69aab965e52b929187cd578e5ebb71d/>PikWizard</a>
</span>
</span>
<span class="image-link">
<span
style="margin: 0 0 20px 0; display: inline-block; vertical-align: middle; width: 100%;"
>
<a
target="_blank"
href="https://pikwizard.com/video/global-financial-data-visualization-with-red-globe-and-graphs/b69aab965e52b929187cd578e5ebb71d/"
style="text-decoration: none; font-size: 10px; margin: 0;"
>
<video controls style="width: 100%; margin: 0;">
<source src="https://player.vimeo.com/progressive_redirect/playback/718654914/rendition/240p/file.mp4?loc=external&oauth2_token_id=1223210874&signature=e2ccad60ec2056de3002cb854c283cc749e7354087624e5b170e75fa8da0a060" type="video/mp4"
poster="https://pikwizard.com/pw/medium/b69aab965e52b929187cd578e5ebb71d.jpg"/>
Your browser does not support the video tag.
</video>
<p style="font-size: 12px; margin: 0;">PikWizard</p>
</a>
</span>
</span>
Free (free of charge)
Free for personal and commercial use.
Author: Awesome Content