
- Home >
- Stock Videos >
- Global Financial Graph with World Map Background Overlay
Global Financial Graph with World Map Background Overlay Video
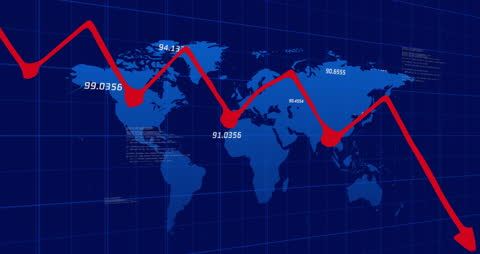
Visualization displays economic growth or decline across global regions. Red graph line suggests movement in markets or statistics. Useful for topics related to global finance, business strategies, economic conditions, and analytics. Suitable for digital content, presentations, or articles on financial trends.
Powered by  - Get 15% off with code: PIKWIZARD15


downloads
Tags:
More
Credit Photo
If you would like to credit the Photo, here are some ways you can do so
Text Link
video Link
<span class="text-link">
<span>
<a target="_blank" href=https://pikwizard.com/video/global-financial-graph-with-world-map-background-overlay/ecf6d8df84b68522c5f606d8b388770f/>PikWizard</a>
</span>
</span>
<span class="image-link">
<span
style="margin: 0 0 20px 0; display: inline-block; vertical-align: middle; width: 100%;"
>
<a
target="_blank"
href="https://pikwizard.com/video/global-financial-graph-with-world-map-background-overlay/ecf6d8df84b68522c5f606d8b388770f/"
style="text-decoration: none; font-size: 10px; margin: 0;"
>
<video controls style="width: 100%; margin: 0;">
<source src="https://player.vimeo.com/progressive_redirect/playback/790441709/rendition/240p/file.mp4?loc=external&oauth2_token_id=1223210874&signature=81adf23ec2bc3b0c073b9464c9973df2e798826c30cb29269eb42be6b513ff66" type="video/mp4"
poster="https://pikwizard.com/pw/medium/ecf6d8df84b68522c5f606d8b388770f.jpg"/>
Your browser does not support the video tag.
</video>
<p style="font-size: 12px; margin: 0;">PikWizard</p>
</a>
</span>
</span>
Free (free of charge)
Free for personal and commercial use.
Author: Awesome Content