
- Home >
- Stock Videos >
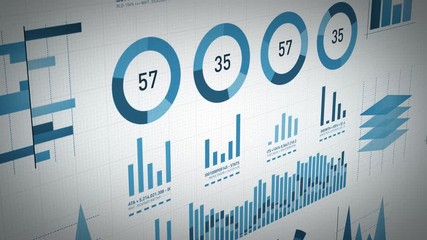
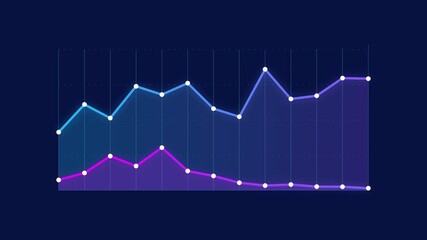
- Global Financial Trends and Data Analysis Visualization
Global Financial Trends and Data Analysis Visualization Video
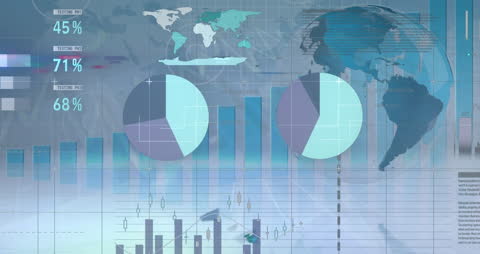
Conveys sophisticated global financial trends through the use of digital charts and maps overlaid on a world map. Useful for illustrating themes of business analysis, market trends, or economic presentations showing global financial interactions. Ideal for use in business reports, presentations, or educational resources focused on data-driven decision-making and economic insights.
Powered by 


downloads
Tags:
More
Credit Photo
If you would like to credit the Photo, here are some ways you can do so
Text Link
video Link
<span class="text-link">
<span>
<a target="_blank" href=https://pikwizard.com/video/global-financial-trends-and-data-analysis-visualization/da4e3b57e4565d39563f57f59cff197a/>PikWizard</a>
</span>
</span>
<span class="image-link">
<span
style="margin: 0 0 20px 0; display: inline-block; vertical-align: middle; width: 100%;"
>
<a
target="_blank"
href="https://pikwizard.com/video/global-financial-trends-and-data-analysis-visualization/da4e3b57e4565d39563f57f59cff197a/"
style="text-decoration: none; font-size: 10px; margin: 0;"
>
<video controls style="width: 100%; margin: 0;">
<source src="https://player.vimeo.com/progressive_redirect/playback/748215442/rendition/240p/file.mp4?loc=external&oauth2_token_id=1223210874&signature=ab4aba09f242e06137ebe334489132b9e8ae8909b050b82ece7d5f5596ff9e60" type="video/mp4"
poster="https://pikwizard.com/pw/medium/da4e3b57e4565d39563f57f59cff197a.jpg"/>
Your browser does not support the video tag.
</video>
<p style="font-size: 12px; margin: 0;">PikWizard</p>
</a>
</span>
</span>
Free (free of charge)
Free for personal and commercial use.
Author: Awesome Content