
- Home >
- Stock Videos >
- Global Financial Trends with World Map and Data Metrics
Global Financial Trends with World Map and Data Metrics Video
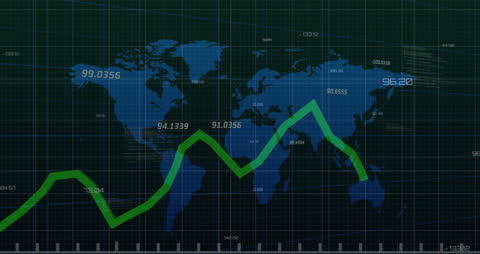
Graphic showing a world map overlaid with financial data metrics, indicating global market trends. Useful for presentations, reports, and articles on international finance, economics, and digital analysis tools.
Powered by  - Get 15% off with code: PIKWIZARD15


1
downloads
downloads
Tags:
More
Credit Photo
If you would like to credit the Photo, here are some ways you can do so
Text Link
video Link
<span class="text-link">
<span>
<a target="_blank" href=https://pikwizard.com/video/global-financial-trends-with-world-map-and-data-metrics/1e80ccfed08bc35f80e8e3cb9ba188ab/>PikWizard</a>
</span>
</span>
<span class="image-link">
<span
style="margin: 0 0 20px 0; display: inline-block; vertical-align: middle; width: 100%;"
>
<a
target="_blank"
href="https://pikwizard.com/video/global-financial-trends-with-world-map-and-data-metrics/1e80ccfed08bc35f80e8e3cb9ba188ab/"
style="text-decoration: none; font-size: 10px; margin: 0;"
>
<video controls style="width: 100%; margin: 0;">
<source src="https://player.vimeo.com/progressive_redirect/playback/717560392/rendition/240p/file.mp4?loc=external&oauth2_token_id=1223210874&signature=15392e7de3e13ec9f7b9c4adffa67146123380207e2baf773562a41750d16896" type="video/mp4"
poster="https://pikwizard.com/pw/medium/1e80ccfed08bc35f80e8e3cb9ba188ab.jpg"/>
Your browser does not support the video tag.
</video>
<p style="font-size: 12px; margin: 0;">PikWizard</p>
</a>
</span>
</span>
Free (free of charge)
Free for personal and commercial use.
Author: Awesome Content