
- Home >
- Stock Videos >
- Global Hotspots Visualization on World Map Animation
Global Hotspots Visualization on World Map Animation Video

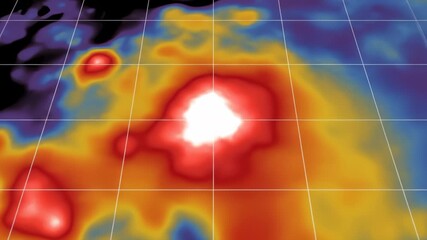
This animation presents a world map with pulsing yellow circles indicating a visualization of global hotspots. The sizing of circles reflects data or communication activity levels, adding a dynamic element to the typical map. Useful for educational forums, technology presentations, and geographical analysis content, the visual emphasizes data accessibility and worldwide connectivity.
Powered by 


downloads
Tags:
More
Credit Photo
If you would like to credit the Photo, here are some ways you can do so
Text Link
video Link
<span class="text-link">
<span>
<a target="_blank" href=https://pikwizard.com/video/global-hotspots-visualization-on-world-map-animation/5a151507e905ea76ca4f24baa8e90577/>PikWizard</a>
</span>
</span>
<span class="image-link">
<span
style="margin: 0 0 20px 0; display: inline-block; vertical-align: middle; width: 100%;"
>
<a
target="_blank"
href="https://pikwizard.com/video/global-hotspots-visualization-on-world-map-animation/5a151507e905ea76ca4f24baa8e90577/"
style="text-decoration: none; font-size: 10px; margin: 0;"
>
<video controls style="width: 100%; margin: 0;">
<source src="https://player.vimeo.com/progressive_redirect/playback/1124068386/rendition/240p/file.mp4?loc=external&oauth2_token_id=1223210874&signature=b42640c22a045e928af9dee150d9542803c007583e29d66e43b208661fa62aa2" type="video/mp4"
poster="https://pikwizard.com/pw/medium/5a151507e905ea76ca4f24baa8e90577.jpg"/>
Your browser does not support the video tag.
</video>
<p style="font-size: 12px; margin: 0;">PikWizard</p>
</a>
</span>
</span>
Free (free of charge)
Free for personal and commercial use.
Author: Awesome Content