
- Home >
- Stock Videos >
- Global Stock Market Analytics Visualization with World Map
Global Stock Market Analytics Visualization with World Map Video
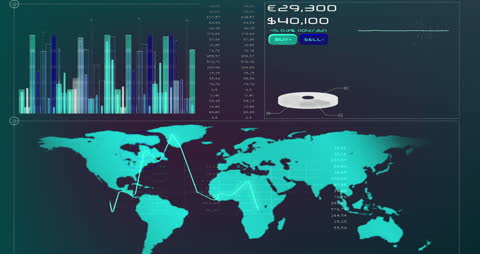
Abstract visualization depicting the processing of global stock market data over a world map backdrop, illustrating real-time analytics. Bright colors and sharp lines communicate the dynamics of finance and technology. Useful for presentations, reports, and interfaces focused on finance, global economics, data analysis, and business innovation.
Powered by 


downloads
Tags:
More
Credit Photo
If you would like to credit the Photo, here are some ways you can do so
Text Link
video Link
<span class="text-link">
<span>
<a target="_blank" href=https://pikwizard.com/video/global-stock-market-analytics-visualization-with-world-map/3d8ed78cdb37e175ab318871b8d0b27d/>PikWizard</a>
</span>
</span>
<span class="image-link">
<span
style="margin: 0 0 20px 0; display: inline-block; vertical-align: middle; width: 100%;"
>
<a
target="_blank"
href="https://pikwizard.com/video/global-stock-market-analytics-visualization-with-world-map/3d8ed78cdb37e175ab318871b8d0b27d/"
style="text-decoration: none; font-size: 10px; margin: 0;"
>
<video controls style="width: 100%; margin: 0;">
<source src="https://player.vimeo.com/progressive_redirect/playback/828705399/rendition/240p/file.mp4?loc=external&oauth2_token_id=1223210874&signature=210e00e6dfde737418be2016b4175b82e0364daf88ea6468a91aac8eb69c672b" type="video/mp4"
poster="https://pikwizard.com/pw/medium/3d8ed78cdb37e175ab318871b8d0b27d.jpg"/>
Your browser does not support the video tag.
</video>
<p style="font-size: 12px; margin: 0;">PikWizard</p>
</a>
</span>
</span>
Free (free of charge)
Free for personal and commercial use.
Author: Awesome Content