
- Home >
- Stock Videos >
- Glossy Graphic Depiction of Real-Time Financial Market Data
Glossy Graphic Depiction of Real-Time Financial Market Data Video
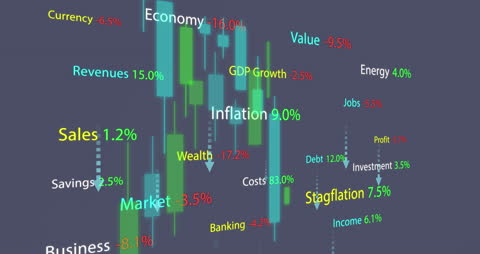
This dynamic infographic showcases a range of economic indicators such as GDP growth, inflation, and sales, ideal for presentations, educational materials, and reports focusing on market trends and financial analysis.
Powered by 


3
downloads
downloads
Tags:
More
Credit Photo
If you would like to credit the Photo, here are some ways you can do so
Text Link
video Link
<span class="text-link">
<span>
<a target="_blank" href=https://pikwizard.com/video/glossy-graphic-depiction-of-real-time-financial-market-data/6e2b067918a24d76e9b2d02710eb9aa3/>PikWizard</a>
</span>
</span>
<span class="image-link">
<span
style="margin: 0 0 20px 0; display: inline-block; vertical-align: middle; width: 100%;"
>
<a
target="_blank"
href="https://pikwizard.com/video/glossy-graphic-depiction-of-real-time-financial-market-data/6e2b067918a24d76e9b2d02710eb9aa3/"
style="text-decoration: none; font-size: 10px; margin: 0;"
>
<video controls style="width: 100%; margin: 0;">
<source src="https://player.vimeo.com/progressive_redirect/playback/860804989/rendition/360p/file.mp4?loc=external&oauth2_token_id=1223210874&signature=b89e63ecf5baf655f37c5ded8529b3e5d9f46dc1e14cbcc46cb00bce285efc1c" type="video/mp4"
poster="https://pikwizard.com/pw/medium/6e2b067918a24d76e9b2d02710eb9aa3.jpg"/>
Your browser does not support the video tag.
</video>
<p style="font-size: 12px; margin: 0;">PikWizard</p>
</a>
</span>
</span>
Free (free of charge)
Free for personal and commercial use.
Author: Awesome Content