
- Home >
- Stock Videos >
- Graph Showing Monthly Trend with Crumbling Numbers
Graph Showing Monthly Trend with Crumbling Numbers Video
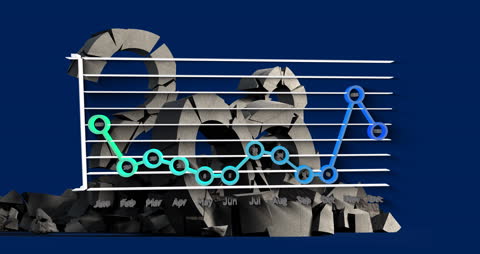
Graph depicting monthly data points in a chart format with textured numbers in a state of decay or crumbling effect. Dynamic representation of changes over the year, ideal for presentations highlighting fluctuation or transformations in financial data. Suitable for illustrating business trends, analytical reports, or economic themes. Utilized to convey both instability and growth in company presentations or reports.

6
downloads
downloads
Tags:
More
Credit Photo
If you would like to credit the Photo, here are some ways you can do so
Text Link
video Link
<span class="text-link">
<span>
<a target="_blank" href=https://pikwizard.com/video/graph-showing-monthly-trend-with-crumbling-numbers/26162cf548c2f0287450e17ba5106fef/>PikWizard</a>
</span>
</span>
<span class="image-link">
<span
style="margin: 0 0 20px 0; display: inline-block; vertical-align: middle; width: 100%;"
>
<a
target="_blank"
href="https://pikwizard.com/video/graph-showing-monthly-trend-with-crumbling-numbers/26162cf548c2f0287450e17ba5106fef/"
style="text-decoration: none; font-size: 10px; margin: 0;"
>
<video controls style="width: 100%; margin: 0;">
<source src="https://player.vimeo.com/progressive_redirect/playback/912397456/rendition/240p/file.mp4?loc=external&oauth2_token_id=1223210874&signature=19fd9db554109d81f6c65b17e29d4b2fdb4b98a47d626f816fefc2e9f5e479a0" type="video/mp4"
poster="https://pikwizard.com/pw/medium/26162cf548c2f0287450e17ba5106fef.jpg"/>
Your browser does not support the video tag.
</video>
<p style="font-size: 12px; margin: 0;">PikWizard</p>
</a>
</span>
</span>
Free (free of charge)
Free for personal and commercial use.
Author: Awesome Content