
- Home >
- Stock Videos >
- Hand Interacting with Digital Financial Chart Overlay
Hand Interacting with Digital Financial Chart Overlay Video
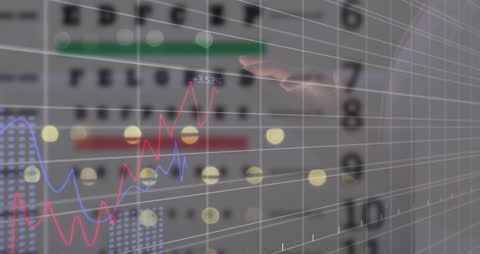
This visualization shows a hand interacting with a digital financial chart overlay. Blended areas show charts and numbers, indicating concepts of business analysis, finance, and technology. Useful for illustrating high-tech investment strategies, integrating digital innovations in finance, or demonstrating statistical data analysis.
Powered by 


downloads
Tags:
More
Credit Photo
If you would like to credit the Photo, here are some ways you can do so
Text Link
video Link
<span class="text-link">
<span>
<a target="_blank" href=https://pikwizard.com/video/hand-interacting-with-digital-financial-chart-overlay/c99d8420bd9b8c154c3a4ef149d8dec7/>PikWizard</a>
</span>
</span>
<span class="image-link">
<span
style="margin: 0 0 20px 0; display: inline-block; vertical-align: middle; width: 100%;"
>
<a
target="_blank"
href="https://pikwizard.com/video/hand-interacting-with-digital-financial-chart-overlay/c99d8420bd9b8c154c3a4ef149d8dec7/"
style="text-decoration: none; font-size: 10px; margin: 0;"
>
<video controls style="width: 100%; margin: 0;">
<source src="https://player.vimeo.com/progressive_redirect/playback/717432005/rendition/360p/file.mp4?loc=external&oauth2_token_id=1223210874&signature=1f6d730a878e618b29e2d702c459d3fc7dd37af506bf934bb75c8ba6a287b166" type="video/mp4"
poster="https://pikwizard.com/pw/medium/c99d8420bd9b8c154c3a4ef149d8dec7.jpg"/>
Your browser does not support the video tag.
</video>
<p style="font-size: 12px; margin: 0;">PikWizard</p>
</a>
</span>
</span>
Free (free of charge)
Free for personal and commercial use.
Author: Awesome Content