
- Home >
- Stock Videos >
- Holographic Financial Analytics and Global Data Visualization
Holographic Financial Analytics and Global Data Visualization Video
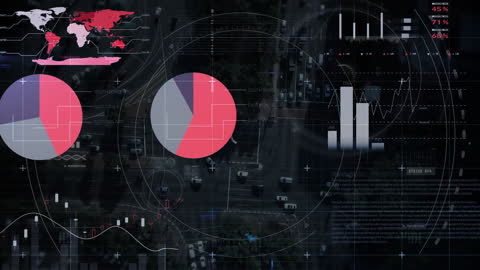
Dynamic composition depicting an intricate financial data processing system rendered as holographic videory. Includes bar graphs, pie charts, and a world map overlay on a busy urban background, which symbolizes global finance and data analytics. Ideal for illustrating financial software interfaces, futuristic business technology, corporate analytics, investing trends, and economic forecasting.
Powered by 


downloads
Tags:
More
Credit Photo
If you would like to credit the Photo, here are some ways you can do so
Text Link
video Link
<span class="text-link">
<span>
<a target="_blank" href=https://pikwizard.com/video/holographic-financial-analytics-and-global-data-visualization/d247103ba371ca3f80d8824d30e856f0/>PikWizard</a>
</span>
</span>
<span class="image-link">
<span
style="margin: 0 0 20px 0; display: inline-block; vertical-align: middle; width: 100%;"
>
<a
target="_blank"
href="https://pikwizard.com/video/holographic-financial-analytics-and-global-data-visualization/d247103ba371ca3f80d8824d30e856f0/"
style="text-decoration: none; font-size: 10px; margin: 0;"
>
<video controls style="width: 100%; margin: 0;">
<source src="https://player.vimeo.com/progressive_redirect/playback/890280844/rendition/240p/file.mp4?loc=external&oauth2_token_id=1223210874&signature=47299b3881c8f01ccae1843cc52a2f3fa70e4614cd64fb04f09fd2a2c000bcd2" type="video/mp4"
poster="https://pikwizard.com/pw/medium/d247103ba371ca3f80d8824d30e856f0.jpg"/>
Your browser does not support the video tag.
</video>
<p style="font-size: 12px; margin: 0;">PikWizard</p>
</a>
</span>
</span>
Free (free of charge)
Free for personal and commercial use.
Author: Awesome Content