
- Home >
- Stock Videos >
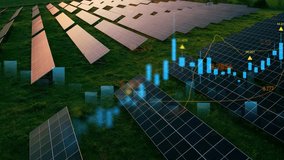
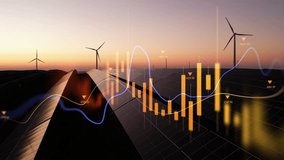
- Innovative Renewable Energy Financial Data Visualization
Innovative Renewable Energy Financial Data Visualization Video
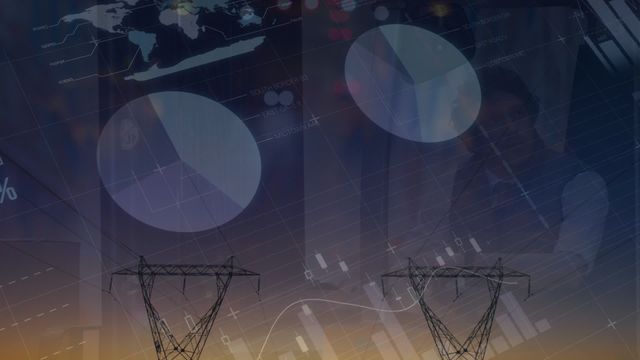
Animation visualizes intersection of energy industry and financial markets. Shows electricity transmission towers against financial graphs, symbolizing growth and economic importance of sustainable resources. Useful for explaining energy finance concepts in presentations, reports on renewable energy trends or technology impacts in environmental content.
Powered by  - Get 15% off with code: PIKWIZARD15


downloads
Tags:
More
Credit Photo
If you would like to credit the Photo, here are some ways you can do so
Text Link
video Link
<span class="text-link">
<span>
<a target="_blank" href=https://pikwizard.com/video/innovative-renewable-energy-financial-data-visualization/8b679f6743f22ed62436f648f1d825ca/>PikWizard</a>
</span>
</span>
<span class="image-link">
<span
style="margin: 0 0 20px 0; display: inline-block; vertical-align: middle; width: 100%;"
>
<a
target="_blank"
href="https://pikwizard.com/video/innovative-renewable-energy-financial-data-visualization/8b679f6743f22ed62436f648f1d825ca/"
style="text-decoration: none; font-size: 10px; margin: 0;"
>
<video controls style="width: 100%; margin: 0;">
<source src="https://player.vimeo.com/progressive_redirect/playback/718535418/rendition/240p/file.mp4?loc=external&oauth2_token_id=1223210874&signature=026f30dfa65bf7bde9106bd51d9426c6b5094bf4ee8633be4ff4b1a825405af4" type="video/mp4"
poster="https://pikwizard.com/pw/medium/8b679f6743f22ed62436f648f1d825ca.jpg"/>
Your browser does not support the video tag.
</video>
<p style="font-size: 12px; margin: 0;">PikWizard</p>
</a>
</span>
</span>
Free (free of charge)
Free for personal and commercial use.
Author: Awesome Content