
- Home >
- Stock Videos >
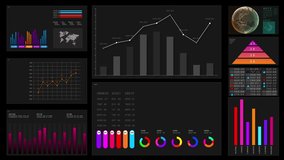
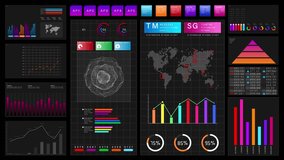
- Interactive Data Analysis Amidst Thunderstorm Background
Interactive Data Analysis Amidst Thunderstorm Background Video

An engaging display of statistical graphs such as pie charts and bar graphs overlaid on a dark, stormy sky. This video creatively merges elements of technology with nature, symbolizing resilience and insight. Ideal for presentations and marketing materials in tech, finance, and data industries wanting to communicate complex information dynamically while capturing user attention.
Powered by  - Get 15% off with code: PIKWIZARD15


downloads
Tags:
More
Credit Photo
If you would like to credit the Photo, here are some ways you can do so
Text Link
video Link
<span class="text-link">
<span>
<a target="_blank" href=https://pikwizard.com/video/interactive-data-analysis-amidst-thunderstorm-background/b1a1e23c22f6db3c7b0fa439e92fccc5/>PikWizard</a>
</span>
</span>
<span class="image-link">
<span
style="margin: 0 0 20px 0; display: inline-block; vertical-align: middle; width: 100%;"
>
<a
target="_blank"
href="https://pikwizard.com/video/interactive-data-analysis-amidst-thunderstorm-background/b1a1e23c22f6db3c7b0fa439e92fccc5/"
style="text-decoration: none; font-size: 10px; margin: 0;"
>
<video controls style="width: 100%; margin: 0;">
<source src="https://player.vimeo.com/progressive_redirect/playback/808106907/rendition/720p/file.mp4?loc=external&oauth2_token_id=1223210874&signature=a312d2bd2b618d62979d83aa6bae946184dbbc85c90cf27b98aa6edb9800f67b" type="video/mp4"
poster="https://pikwizard.com/pw/medium/b1a1e23c22f6db3c7b0fa439e92fccc5.jpg"/>
Your browser does not support the video tag.
</video>
<p style="font-size: 12px; margin: 0;">PikWizard</p>
</a>
</span>
</span>
Free (free of charge)
Free for personal and commercial use.
Author: Awesome Content