
- Home >
- Stock Videos >
- Interactive Data Visualization of Monthly Trends
Interactive Data Visualization of Monthly Trends Video
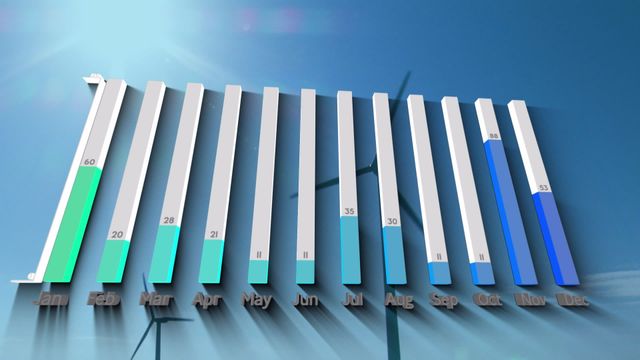
Animation showcases monthly data trends in a clean and effective bar chart format against background of wind turbines under a sunny sky. Emphasizes concept of renewable energy with digital graphical elements, highlighting evolving use of sustainable practices in global industries. Ideal for presentations, educational purposes on environmental awareness, and sustainability reports.
Powered by  - Get 15% off with code: PIKWIZARD15


downloads
Tags:
More
Credit Photo
If you would like to credit the Photo, here are some ways you can do so
Text Link
video Link
<span class="text-link">
<span>
<a target="_blank" href=https://pikwizard.com/video/interactive-data-visualization-of-monthly-trends/93a636905011db161423f6ef2024a9e9/>PikWizard</a>
</span>
</span>
<span class="image-link">
<span
style="margin: 0 0 20px 0; display: inline-block; vertical-align: middle; width: 100%;"
>
<a
target="_blank"
href="https://pikwizard.com/video/interactive-data-visualization-of-monthly-trends/93a636905011db161423f6ef2024a9e9/"
style="text-decoration: none; font-size: 10px; margin: 0;"
>
<video controls style="width: 100%; margin: 0;">
<source src="https://player.vimeo.com/progressive_redirect/playback/717348296/rendition/240p/file.mp4?loc=external&oauth2_token_id=1223210874&signature=734dac0db5d975f8e969114244ade395d5dcf15fe0916d7bffd444339175006f" type="video/mp4"
poster="https://pikwizard.com/pw/medium/93a636905011db161423f6ef2024a9e9.jpg"/>
Your browser does not support the video tag.
</video>
<p style="font-size: 12px; margin: 0;">PikWizard</p>
</a>
</span>
</span>
Free (free of charge)
Free for personal and commercial use.
Author: Awesome Content