
- Home >
- Stock Videos >
- Interactive Data Visualizations in Warehouse Logistics
Interactive Data Visualizations in Warehouse Logistics Video
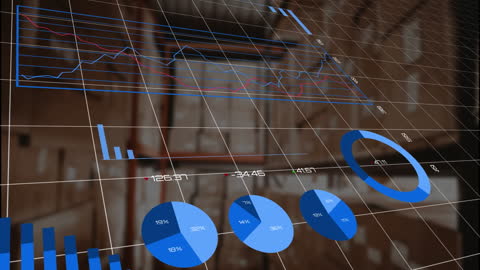
This representation shows digital data visualizations in a warehouse context, showcasing pie charts and line graphs. Useful for illustrating themes of modern logistics, supply chain management, and the integration of technology in traditional field operations. Perfect for business presentations, educational materials on data analysis, or articles on technological advancements in warehouses.

downloads
Tags:
More
Credit Photo
If you would like to credit the Photo, here are some ways you can do so
Text Link
video Link
<span class="text-link">
<span>
<a target="_blank" href=https://pikwizard.com/video/interactive-data-visualizations-in-warehouse-logistics/c238e1fabdde2021e57a858d50a0c0f6/>PikWizard</a>
</span>
</span>
<span class="image-link">
<span
style="margin: 0 0 20px 0; display: inline-block; vertical-align: middle; width: 100%;"
>
<a
target="_blank"
href="https://pikwizard.com/video/interactive-data-visualizations-in-warehouse-logistics/c238e1fabdde2021e57a858d50a0c0f6/"
style="text-decoration: none; font-size: 10px; margin: 0;"
>
<video controls style="width: 100%; margin: 0;">
<source src="https://player.vimeo.com/progressive_redirect/playback/770061484/rendition/240p/file.mp4?loc=external&oauth2_token_id=1223210874&signature=901bc1d13e86106ea343ee9f9078b573e5336c0ffab3aa38b391f7989714c19d" type="video/mp4"
poster="https://pikwizard.com/pw/medium/c238e1fabdde2021e57a858d50a0c0f6.jpg"/>
Your browser does not support the video tag.
</video>
<p style="font-size: 12px; margin: 0;">PikWizard</p>
</a>
</span>
</span>
Free (free of charge)
Free for personal and commercial use.
Author: Awesome Content