
- Home >
- Stock Videos >
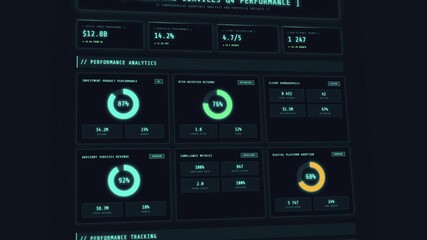
- Interactive Financial Dashboard Animation with Growing Bar Graphs
Interactive Financial Dashboard Animation with Growing Bar Graphs Video

Recognizable scene depicting intricate financial data visualization typically used in business analysis or stock market analytics. Visible alignment of vertical bar graphs alongside line tracks simplifies heavy data, enhancing real time decision-making and insights into market trends. Suitable for financial seminars, presentations depicting dynamic data representation skills or tools developed exclusively for monitoring economic scenaries and data personnels operational practices.
Powered by 


0
downloads
downloads
Tags:
More
Credit Photo
If you would like to credit the Photo, here are some ways you can do so
Text Link
video Link
<span class="text-link">
<span>
<a target="_blank" href=https://pikwizard.com/video/interactive-financial-dashboard-animation-with-growing-bar-graphs/60762afbd1c64565d1720d182f23759f/>PikWizard</a>
</span>
</span>
<span class="image-link">
<span
style="margin: 0 0 20px 0; display: inline-block; vertical-align: middle; width: 100%;"
>
<a
target="_blank"
href="https://pikwizard.com/video/interactive-financial-dashboard-animation-with-growing-bar-graphs/60762afbd1c64565d1720d182f23759f/"
style="text-decoration: none; font-size: 10px; margin: 0;"
>
<video controls style="width: 100%; margin: 0;">
<source src="https://player.vimeo.com/progressive_redirect/playback/1132726434/rendition/240p/file.mp4?loc=external&oauth2_token_id=1223210874&signature=af00f3b640931fb80ba394c6bb0149e6bd5531d28f914f54eca2300866c529f4" type="video/mp4"
poster="https://pikwizard.com/pw/medium/60762afbd1c64565d1720d182f23759f.jpg"/>
Your browser does not support the video tag.
</video>
<p style="font-size: 12px; margin: 0;">PikWizard</p>
</a>
</span>
</span>
Free (free of charge)
Free for personal and commercial use.
Author: Awesome Content