
- Home >
- Stock Videos >
- Interactive Social Media and Subscriber Analytics Visualization
Interactive Social Media and Subscriber Analytics Visualization Video
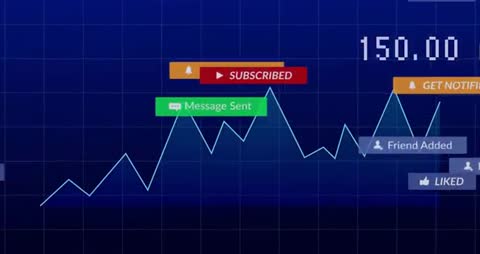
This detailed display captures the dynamic interface of a data analytics dashboard, incorporating elements like line graphs and real-time social media notifications for activities such as message sent and user interactions. Ideal for illustrating concepts of digital analytics, webpage design, and interactive technology developments, it serves professionals focused on data monitoring, digital growth metrics, and interface enhancement presentations.

downloads
Tags:
More
Credit Photo
If you would like to credit the Photo, here are some ways you can do so
Text Link
video Link
<span class="text-link">
<span>
<a target="_blank" href=https://pikwizard.com/video/interactive-social-media-and-subscriber-analytics-visualization/b53723c5a2fe5bb3bfbf025eafb2aab9/>PikWizard</a>
</span>
</span>
<span class="image-link">
<span
style="margin: 0 0 20px 0; display: inline-block; vertical-align: middle; width: 100%;"
>
<a
target="_blank"
href="https://pikwizard.com/video/interactive-social-media-and-subscriber-analytics-visualization/b53723c5a2fe5bb3bfbf025eafb2aab9/"
style="text-decoration: none; font-size: 10px; margin: 0;"
>
<video controls style="width: 100%; margin: 0;">
<source src="https://player.vimeo.com/progressive_redirect/playback/1119269729/rendition/240p/file.mp4?loc=external&oauth2_token_id=1223210874&signature=a01fa039c5f8f2145f89947ff0c882d2763281e6d4274d9a2ecd52544a4573ef" type="video/mp4"
poster="https://pikwizard.com/pw/medium/b53723c5a2fe5bb3bfbf025eafb2aab9.jpg"/>
Your browser does not support the video tag.
</video>
<p style="font-size: 12px; margin: 0;">PikWizard</p>
</a>
</span>
</span>
Free (free of charge)
Free for personal and commercial use.
Author: Awesome Content