
- Home >
- Stock Videos >
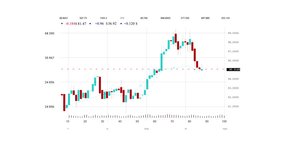
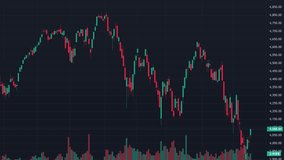
- Live trading chart reacting to spike and correction with candlesticks, moving average, volume
Live trading chart reacting to spike and correction with candlesticks, moving average, volume Video

AI Generated Image. Displaying high-contrast trading dashboard with red and green candlesticks reacting to sharp spike followed by rapid correction. Blue moving average line tracking price momentum while volume bars logging trading activity. Ticker numbers and market grid scrolling in background, creating sense of real-time market flux. AI-generated visual offering cinematic shallow depth of field and vibrant color contrast. Fitting for financial news backgrounds, trading tutorials, market analysis videos, fintech product demos, investor presentations, website hero headers, social media promos. Enhancing content about market volatility, price action, technical indicators, algorithmic trading, risk management. Pairing with voiceover explaining market drivers or overlaying data callouts and annotations. Delivering dynamic visual for educational clips, blog video intros, TV segments, corporate reports. Optimizing for widescreen use; suitable for broadcast and web projects; compatible with overlay graphics and lower thirds. Providing loop-friendly motion and clear focal point for branding or logo placement.
Powered by  - Get 15% off with code: PIKWIZARD15


0
downloads
downloads
Tags:
More
Credit Photo
If you would like to credit the Photo, here are some ways you can do so
Text Link
video Link
<span class="text-link">
<span>
<a target="_blank" href=https://pikwizard.com/video/live-trading-chart-reacting-to-spike-and-correction-with-candlesticks-moving-average-volume/97a3f16e46f5c4cfbbbe9cf3708bd024/>PikWizard</a>
</span>
</span>
<span class="image-link">
<span
style="margin: 0 0 20px 0; display: inline-block; vertical-align: middle; width: 100%;"
>
<a
target="_blank"
href="https://pikwizard.com/video/live-trading-chart-reacting-to-spike-and-correction-with-candlesticks-moving-average-volume/97a3f16e46f5c4cfbbbe9cf3708bd024/"
style="text-decoration: none; font-size: 10px; margin: 0;"
>
<video controls style="width: 100%; margin: 0;">
<source src="https://player.vimeo.com/progressive_redirect/playback/1142510779/rendition/240p/file.mp4?loc=external&oauth2_token_id=1223210874&signature=57d9854de7abd46b22786adb3ec42e8910a361a423d7259f32245bce9fb8debe" type="video/mp4"
poster="https://pikwizard.com/pw/medium/97a3f16e46f5c4cfbbbe9cf3708bd024.jpg"/>
Your browser does not support the video tag.
</video>
<p style="font-size: 12px; margin: 0;">PikWizard</p>
</a>
</span>
</span>
Free (free of charge)
Free for personal and commercial use.
Author: AI Creator