
- Home >
- Stock Videos >
- Man Analyzing Financial Data Overactive Market Charts in Modern Office
Man Analyzing Financial Data Overactive Market Charts in Modern Office Video
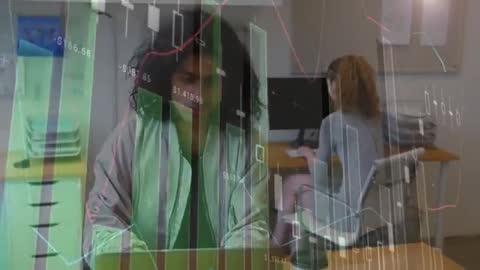
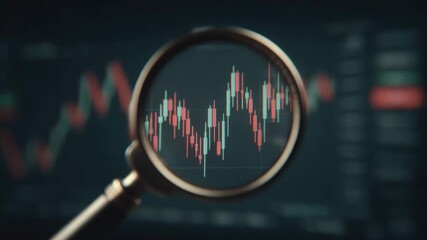
Man engaging deeply with electronic financial charts overlaid with stock data, symbolizes professional market analysis. Candlestick and bar charts visually signify active financial monitoring and robotic data interpretation in a corporate environment. Useful for themes related to market investments, stock trading platforms, technological advancements in economics and modern workplace settings involving data-driven decisions.
Powered by 


0
downloads
downloads
Tags:
More
Credit Photo
If you would like to credit the Photo, here are some ways you can do so
Text Link
video Link
<span class="text-link">
<span>
<a target="_blank" href=https://pikwizard.com/video/man-analyzing-financial-data-overactive-market-charts-in-modern-office/5680f483b9cda765b4d16406003baace/>PikWizard</a>
</span>
</span>
<span class="image-link">
<span
style="margin: 0 0 20px 0; display: inline-block; vertical-align: middle; width: 100%;"
>
<a
target="_blank"
href="https://pikwizard.com/video/man-analyzing-financial-data-overactive-market-charts-in-modern-office/5680f483b9cda765b4d16406003baace/"
style="text-decoration: none; font-size: 10px; margin: 0;"
>
<video controls style="width: 100%; margin: 0;">
<source src="" type="video/mp4"
poster="https://pikwizard.com/pw/medium/5680f483b9cda765b4d16406003baace.jpg"/>
Your browser does not support the video tag.
</video>
<p style="font-size: 12px; margin: 0;">PikWizard</p>
</a>
</span>
</span>
Free (free of charge)
Free for personal and commercial use.
Author: Awesome Content