
- Home >
- Stock Videos >
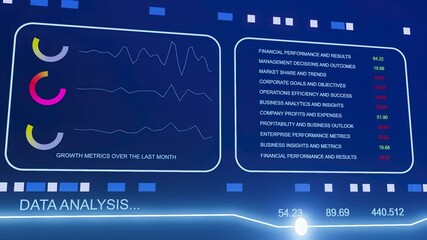
- Modern 3D Graph with Color Gradient Nodes Representing Data Trends
Modern 3D Graph with Color Gradient Nodes Representing Data Trends Video

This modern 3D graph with colorful nodes shows data trends across a year. Useful for presentations on data analysis or technology integration, highlighting business analytics or statistical software advancements.
Powered by 


downloads
Tags:
More
Credit Photo
If you would like to credit the Photo, here are some ways you can do so
Text Link
video Link
<span class="text-link">
<span>
<a target="_blank" href=https://pikwizard.com/video/modern-3d-graph-with-color-gradient-nodes-representing-data-trends/cf5032f05e694537ae1ecb63ba365678/>PikWizard</a>
</span>
</span>
<span class="image-link">
<span
style="margin: 0 0 20px 0; display: inline-block; vertical-align: middle; width: 100%;"
>
<a
target="_blank"
href="https://pikwizard.com/video/modern-3d-graph-with-color-gradient-nodes-representing-data-trends/cf5032f05e694537ae1ecb63ba365678/"
style="text-decoration: none; font-size: 10px; margin: 0;"
>
<video controls style="width: 100%; margin: 0;">
<source src="https://player.vimeo.com/progressive_redirect/playback/736578947/rendition/240p/file.mp4?loc=external&oauth2_token_id=1223210874&signature=7bc3c59e4a55a0933ba478847c7247724d56cd026d043fc3ccf64fbc7a74df1e" type="video/mp4"
poster="https://pikwizard.com/pw/medium/cf5032f05e694537ae1ecb63ba365678.jpg"/>
Your browser does not support the video tag.
</video>
<p style="font-size: 12px; margin: 0;">PikWizard</p>
</a>
</span>
</span>
Free (free of charge)
Free for personal and commercial use.
Author: Awesome Content