
- Home >
- Stock Videos >
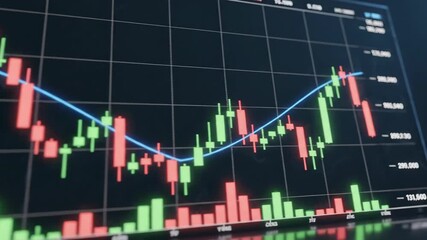
- Modern Business and Finance Cityscape with Digital Stock Charts
Modern Business and Finance Cityscape with Digital Stock Charts Video

This video illustrates a digital composition of stock market charts blending with a view of modern skyscrapers. It signifies finance technology and urban advancement, ideal for use in finance presentations, business reports, or as a dynamic visual for articles on investment and economics.
Powered by 


0
downloads
downloads
Tags:
More
Credit Photo
If you would like to credit the Photo, here are some ways you can do so
Text Link
video Link
<span class="text-link">
<span>
<a target="_blank" href=https://pikwizard.com/video/modern-business-and-finance-cityscape-with-digital-stock-charts/c15371f7d8e8cc785de70ca8e09af745/>PikWizard</a>
</span>
</span>
<span class="image-link">
<span
style="margin: 0 0 20px 0; display: inline-block; vertical-align: middle; width: 100%;"
>
<a
target="_blank"
href="https://pikwizard.com/video/modern-business-and-finance-cityscape-with-digital-stock-charts/c15371f7d8e8cc785de70ca8e09af745/"
style="text-decoration: none; font-size: 10px; margin: 0;"
>
<video controls style="width: 100%; margin: 0;">
<source src="https://player.vimeo.com/progressive_redirect/playback/907549191/rendition/240p/file.mp4?loc=external&oauth2_token_id=1223210874&signature=ed1312ce3bf68fb9fe0e8b0717fd7a971ac71eceff85048d09cab7d04db2a5b3" type="video/mp4"
poster="https://pikwizard.com/pw/medium/c15371f7d8e8cc785de70ca8e09af745.jpg"/>
Your browser does not support the video tag.
</video>
<p style="font-size: 12px; margin: 0;">PikWizard</p>
</a>
</span>
</span>
Free (free of charge)
Free for personal and commercial use.
Author: Awesome Content