
- Home >
- Stock Videos >
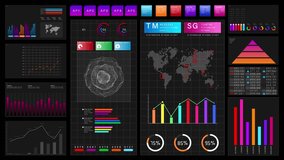
- Modern Digital Dashboard with Interactive Graphs
Modern Digital Dashboard with Interactive Graphs Video
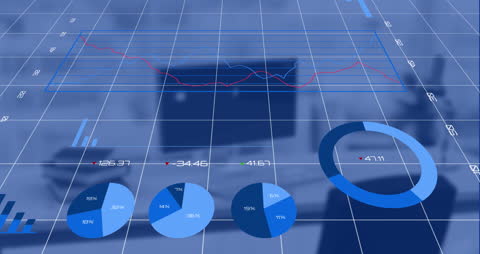
This visualization showcases a digital dashboard with dynamic graphs and data overlays. It is ideal for depicting themes related to financial analysis, business growth, and technological advancements. Useful for presentations and reports in finance, business planning, and data technology sectors, where a modern and dynamic illustration of data concepts is needed.
Powered by  - Get 15% off with code: PIKWIZARD15


downloads
Tags:
More
Credit Photo
If you would like to credit the Photo, here are some ways you can do so
Text Link
video Link
<span class="text-link">
<span>
<a target="_blank" href=https://pikwizard.com/video/modern-digital-dashboard-with-interactive-graphs/958b313c952b13ddfa27beb6136140f3/>PikWizard</a>
</span>
</span>
<span class="image-link">
<span
style="margin: 0 0 20px 0; display: inline-block; vertical-align: middle; width: 100%;"
>
<a
target="_blank"
href="https://pikwizard.com/video/modern-digital-dashboard-with-interactive-graphs/958b313c952b13ddfa27beb6136140f3/"
style="text-decoration: none; font-size: 10px; margin: 0;"
>
<video controls style="width: 100%; margin: 0;">
<source src="https://player.vimeo.com/progressive_redirect/playback/820516802/rendition/240p/file.mp4?loc=external&oauth2_token_id=1223210874&signature=4896ffee38069e0541fa42db7d4da0255f6d065a34e458aae5ea9fd0eaf921ca" type="video/mp4"
poster="https://pikwizard.com/pw/medium/958b313c952b13ddfa27beb6136140f3.jpg"/>
Your browser does not support the video tag.
</video>
<p style="font-size: 12px; margin: 0;">PikWizard</p>
</a>
</span>
</span>
Free (free of charge)
Free for personal and commercial use.
Author: Awesome Content