
- Home >
- Stock Videos >
- Monthly Data Visualization Over Cityscape Skyline
Monthly Data Visualization Over Cityscape Skyline Video
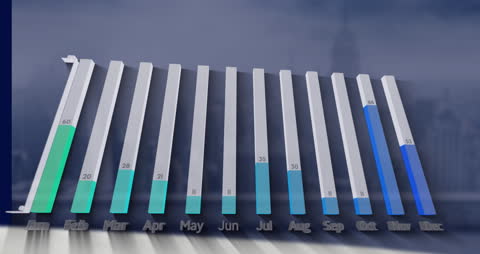
Three-dimensional graph depicted over modern city skyline highlights monthly data analysis. Useful for business growth presentations, financial reports, market trend analysis, and digital data insights discussions. Creates a futuristic setting perfect for illustrating progress or statistics.
Powered by 


downloads
Tags:
More
Credit Photo
If you would like to credit the Photo, here are some ways you can do so
Text Link
video Link
<span class="text-link">
<span>
<a target="_blank" href=https://pikwizard.com/video/monthly-data-visualization-over-cityscape-skyline/11ef696966c99f50e161d405ae73621f/>PikWizard</a>
</span>
</span>
<span class="image-link">
<span
style="margin: 0 0 20px 0; display: inline-block; vertical-align: middle; width: 100%;"
>
<a
target="_blank"
href="https://pikwizard.com/video/monthly-data-visualization-over-cityscape-skyline/11ef696966c99f50e161d405ae73621f/"
style="text-decoration: none; font-size: 10px; margin: 0;"
>
<video controls style="width: 100%; margin: 0;">
<source src="https://player.vimeo.com/progressive_redirect/playback/736708794/rendition/240p/file.mp4?loc=external&oauth2_token_id=1223210874&signature=a52a4c566557771cb2fe8487ef49a0959f25f9b7dff4ff3a9617f1b5b06d732b" type="video/mp4"
poster="https://pikwizard.com/pw/medium/11ef696966c99f50e161d405ae73621f.jpg"/>
Your browser does not support the video tag.
</video>
<p style="font-size: 12px; margin: 0;">PikWizard</p>
</a>
</span>
</span>
Free (free of charge)
Free for personal and commercial use.
Author: Awesome Content