
- Home >
- Stock Videos >
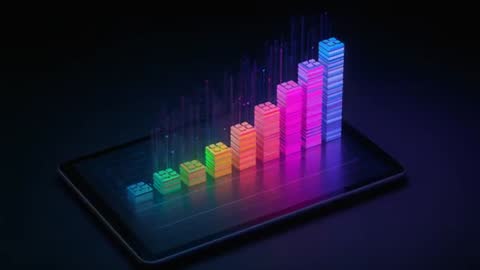
- Neon 3D Bar Chart Rising on Tablet Display Visualizing Data Growth with Particle Trails
Neon 3D Bar Chart Rising on Tablet Display Visualizing Data Growth with Particle Trails Video
AI
AI Generated Video. Video showing neon 3D bar chart rising from tablet display, stacked columns glowing in rainbow gradient and emitting particle trails suggesting data flow. Bars progressing left to right illustrating steady digital growth and analytics trends, with subtle reflections on glass surface. Dark studio background emphasizing neon color palette and futuristic tech mood, motion-friendly for looping sequences. Useful for business presentations, fintech dashboards, marketing hero banners, social media ads, explainer videos highlighting performance metrics, revenue growth, AI-driven insights. Customizable for branding by swapping colors, adjusting speed, adding overlay text and data labels.
Powered by 


downloads
Tags:
More
Credit Photo
If you would like to credit the Photo, here are some ways you can do so
Text Link
video Link
<span class="text-link">
<span>
<a target="_blank" href=https://pikwizard.com/video/neon-3d-bar-chart-rising-on-tablet-display-visualizing-data-growth-with-particle-trails/337fa88bd8547b288564e4f23c38e8ff/>PikWizard</a>
</span>
</span>
<span class="image-link">
<span
style="margin: 0 0 20px 0; display: inline-block; vertical-align: middle; width: 100%;"
>
<a
target="_blank"
href="https://pikwizard.com/video/neon-3d-bar-chart-rising-on-tablet-display-visualizing-data-growth-with-particle-trails/337fa88bd8547b288564e4f23c38e8ff/"
style="text-decoration: none; font-size: 10px; margin: 0;"
>
<video controls style="width: 100%; margin: 0;">
<source src="https://player.vimeo.com/progressive_redirect/playback/1137156456/rendition/240p/file.mp4?loc=external&oauth2_token_id=1223210874&signature=009a2db93455d1c2b5144ba73ba77a84434483581b18edcf15ac8d330e6e9db4" type="video/mp4"
poster="https://pikwizard.com/pw/medium/337fa88bd8547b288564e4f23c38e8ff.jpg"/>
Your browser does not support the video tag.
</video>
<p style="font-size: 12px; margin: 0;">PikWizard</p>
</a>
</span>
</span>
Free (free of charge)
Free for personal and commercial use.
Author: AI Creator