
- Home >
- Stock Videos >
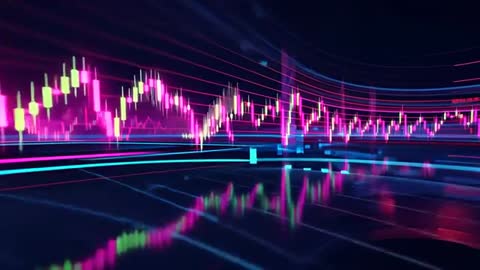
- Neon Digital Chart Visualization of Candlestick Patterns
Neon Digital Chart Visualization of Candlestick Patterns Video
AI
AI Generated Video. This dynamic video frame illustrates glowing neon candlestick patterns on a sleek, reflective surface, creating an immersive representation of stock market activities. With its futuristic design and vibrant colors, it is ideal for themes involving data analysis, stock market trends, modern technology, and financial growth. Perfect for use in presentations, financial reports, or tech industry promotions, capturing the essence of digital transformation in finance and investment.
Powered by 


downloads
Tags:
More
Credit Photo
If you would like to credit the Photo, here are some ways you can do so
Text Link
video Link
<span class="text-link">
<span>
<a target="_blank" href=https://pikwizard.com/video/neon-digital-chart-visualization-of-candlestick-patterns/f2314d2736db703e058c34369368f2b4/>PikWizard</a>
</span>
</span>
<span class="image-link">
<span
style="margin: 0 0 20px 0; display: inline-block; vertical-align: middle; width: 100%;"
>
<a
target="_blank"
href="https://pikwizard.com/video/neon-digital-chart-visualization-of-candlestick-patterns/f2314d2736db703e058c34369368f2b4/"
style="text-decoration: none; font-size: 10px; margin: 0;"
>
<video controls style="width: 100%; margin: 0;">
<source src="https://player.vimeo.com/progressive_redirect/playback/1131905671/rendition/240p/file.mp4?loc=external&oauth2_token_id=1223210874&signature=b0261f16fa98983717483f1452ab969486351e05fd0f54b3833fcc6678e9766e" type="video/mp4"
poster="https://pikwizard.com/pw/medium/f2314d2736db703e058c34369368f2b4.jpg"/>
Your browser does not support the video tag.
</video>
<p style="font-size: 12px; margin: 0;">PikWizard</p>
</a>
</span>
</span>
Free (free of charge)
Free for personal and commercial use.
Author: AI Creator