
- Home >
- Free Stock Videos >
- Pointing Host Presenting Interactive Data Dashboard in Vertical Boardroom Video
Pointing Host Presenting Interactive Data Dashboard in Vertical Boardroom Free Stock Video
AI
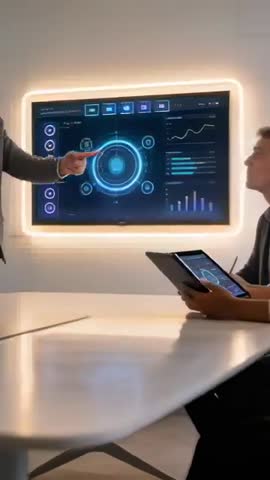
AI Generated Video. Vertical video showing host in jacket pointing at interactive data dashboard on wall display while peer holds tablet mirroring same charts and metrics. Dashboard featuring circular interface, line graphs, bar charts, progress bars, and KPI panels for performance tracking. Team members discussing insights, comparing tablet and screen data, and planning next steps using gestures and notes. Visual style combining cool blue UI tones with backlit display for modern tech look. Ideas for use: using in corporate training videos, investor pitch reels, SaaS product demos, business intelligence marketing, analytics feature tutorials, keynote presentations, social vertical ads for Instagram Stories and TikTok, website hero banners, onboarding and sales enablement materials. Editing tips: cropping for 9:16 vertical formats, adding lower third captions, overlaying brand colors and call to action.
Powered by  - Get 15% off with code: PIKWIZARD15


downloads
Tags:
More
Credit Photo
If you would like to credit the Photo, here are some ways you can do so
Text Link
video Link
<span class="text-link">
<span>
<a target="_blank" href=https://pikwizard.com/video/pointing-host-presenting-interactive-data-dashboard-in-vertical-boardroom-video/fa3746a63dc77b93e947cd16f450df3f/>PikWizard</a>
</span>
</span>
<span class="image-link">
<span
style="margin: 0 0 20px 0; display: inline-block; vertical-align: middle; width: 100%;"
>
<a
target="_blank"
href="https://pikwizard.com/video/pointing-host-presenting-interactive-data-dashboard-in-vertical-boardroom-video/fa3746a63dc77b93e947cd16f450df3f/"
style="text-decoration: none; font-size: 10px; margin: 0;"
>
<video controls style="width: 100%; margin: 0;">
<source src="https://player.vimeo.com/progressive_redirect/playback/1193690907/rendition/240p/file.mp4%20%28240p%29.mp4?loc=external&oauth2_token_id=1223210874&signature=36f0b7818cf75729df28aed6924ba769cac92b478a7b1c8e072b4eefdc3c27a8" type="video/mp4"
poster="https://thumbs.wbm.im/pw/medium/fa3746a63dc77b93e947cd16f450df3f.jpg"/>
Your browser does not support the video tag.
</video>
<p style="font-size: 12px; margin: 0;">PikWizard</p>
</a>
</span>
</span>
Free (free of charge)
Free for personal and commercial use.
Author: AI Creator