
- Home >
- Free Stock Videos >
- Real-time Animated Market Chart Updating with Candlestick Trends, Waveform, Live Tick Data
Real-time Animated Market Chart Updating with Candlestick Trends, Waveform, Live Tick Data Free Stock Video

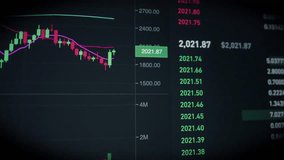
Video frame showing animated financial chart with candlestick bars, rising and falling waveform, and scrolling tick markers in neon green and blue palette. Layered gridlines and translucent overlays creating deep perspective and motion. Vertical green glyphs adding cyberpunk data-stream accent. Useful for fintech promo, trading platform demo, market analysis tutorial, broadcast graphics, investor presentation, app UI mockup, or educational explainer. Suggested edits include replacing sample data with real feeds, changing color palette to match brand, adding headline text and lower-third, looping for background ambience, slowing motion for emphasis, and overlaying logo and call-to-action. Licensing suited for commercial and editorial use in finance, technology, and media projects.
Powered by  - Get 15% off with code: PIKWIZARD15


downloads
Tags:
More
Credit Photo
If you would like to credit the Photo, here are some ways you can do so
Text Link
video Link
<span class="text-link">
<span>
<a target="_blank" href=https://pikwizard.com/video/real-time-animated-market-chart-updating-with-candlestick-trends-waveform-live-tick-data/fcd4b77c19fdee73ca1dac649c108d56/>PikWizard</a>
</span>
</span>
<span class="image-link">
<span
style="margin: 0 0 20px 0; display: inline-block; vertical-align: middle; width: 100%;"
>
<a
target="_blank"
href="https://pikwizard.com/video/real-time-animated-market-chart-updating-with-candlestick-trends-waveform-live-tick-data/fcd4b77c19fdee73ca1dac649c108d56/"
style="text-decoration: none; font-size: 10px; margin: 0;"
>
<video controls style="width: 100%; margin: 0;">
<source src="https://player.vimeo.com/progressive_redirect/playback/1163024719/rendition/360p/file.mp4%20%28360p%29.mp4?loc=external&oauth2_token_id=1223210874&signature=2d01fd5cc9f13a2927d98e735f13c5607f6ad1d2dd850027e8aee31ae6081f7d" type="video/mp4"
poster="https://thumbs.wbm.im/pw/medium/fcd4b77c19fdee73ca1dac649c108d56.jpg"/>
Your browser does not support the video tag.
</video>
<p style="font-size: 12px; margin: 0;">PikWizard</p>
</a>
</span>
</span>
Free (free of charge)
Free for personal and commercial use.
Author: Awesome Content