
- Home >
- Stock Videos >
- Red Bar and Line Graph Overlaying Foliage Illustrating Data Trends
Red Bar and Line Graph Overlaying Foliage Illustrating Data Trends Video
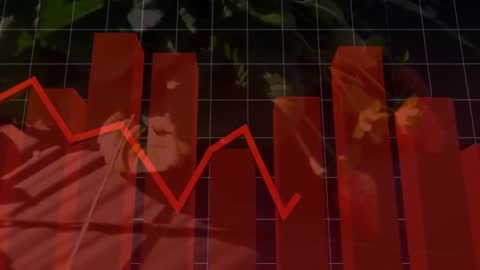
Visual showcasing integration of data trends with bar and line graphs over background patent shows industry efforts toward fusion makes ideal for representing paragraphs organizations assimilating analyzing performance growth pursuing sustainability
Powered by 


0
downloads
downloads
Tags:
More
Credit Photo
If you would like to credit the Photo, here are some ways you can do so
Text Link
video Link
<span class="text-link">
<span>
<a target="_blank" href=https://pikwizard.com/video/red-bar-and-line-graph-overlaying-foliage-illustrating-data-trends/dae159ffaf869711f4d8b274b6937cdb/>PikWizard</a>
</span>
</span>
<span class="image-link">
<span
style="margin: 0 0 20px 0; display: inline-block; vertical-align: middle; width: 100%;"
>
<a
target="_blank"
href="https://pikwizard.com/video/red-bar-and-line-graph-overlaying-foliage-illustrating-data-trends/dae159ffaf869711f4d8b274b6937cdb/"
style="text-decoration: none; font-size: 10px; margin: 0;"
>
<video controls style="width: 100%; margin: 0;">
<source src="https://player.vimeo.com/progressive_redirect/playback/1090384888/rendition/240p/file.mp4?loc=external&oauth2_token_id=1223210874&signature=176ece0c2a18419929a6c7bbf712da31235d81ac98c1c32533f9ca18591e2100" type="video/mp4"
poster="https://pikwizard.com/pw/medium/dae159ffaf869711f4d8b274b6937cdb.jpg"/>
Your browser does not support the video tag.
</video>
<p style="font-size: 12px; margin: 0;">PikWizard</p>
</a>
</span>
</span>
Free (free of charge)
Free for personal and commercial use.
Author: Awesome Content