
- Home >
- Free Stock Videos >
- Remote presenter explaining charts while viewer analyzing candlestick graphs with HUD overlay
Remote presenter explaining charts while viewer analyzing candlestick graphs with HUD overlay Free Stock Video
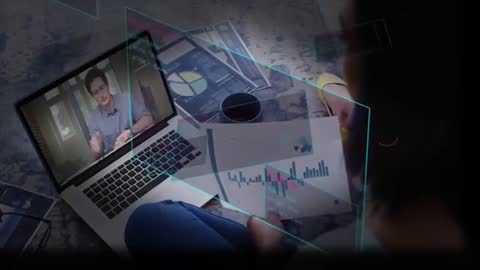
Video clip featuring remote presenter on laptop while viewer scanning printed reports and analyzing candlestick graphs with translucent HUD overlay highlighting trends, metrics, and latency data. Foreground focusing on hands, paperwork, laptop keyboard and coffee cup; background fading to moody vignette with neon teal data lines and markers. Visual tone conveying professional remote collaboration, live coaching, and financial review. Use cases: creating webinar intros, illustrating remote teamwork for corporate communications, promoting fintech or trading platform features, enhancing blog posts and articles about market analysis, supporting investor pitch videos, designing hero banners for SaaS dashboards, generating thumbnail for virtual training modules, and producing social media ads about analytics tools.
Powered by  - Get 15% off with code: PIKWIZARD15


downloads
Tags:
More
Credit Photo
If you would like to credit the Photo, here are some ways you can do so
Text Link
video Link
<span class="text-link">
<span>
<a target="_blank" href=https://pikwizard.com/video/remote-presenter-explaining-charts-while-viewer-analyzing-candlestick-graphs-with-hud-overlay/6ab006dd8a6d7323de4bfd1098f6b88f/>PikWizard</a>
</span>
</span>
<span class="image-link">
<span
style="margin: 0 0 20px 0; display: inline-block; vertical-align: middle; width: 100%;"
>
<a
target="_blank"
href="https://pikwizard.com/video/remote-presenter-explaining-charts-while-viewer-analyzing-candlestick-graphs-with-hud-overlay/6ab006dd8a6d7323de4bfd1098f6b88f/"
style="text-decoration: none; font-size: 10px; margin: 0;"
>
<video controls style="width: 100%; margin: 0;">
<source src="https://player.vimeo.com/progressive_redirect/playback/1178749375/rendition/240p/file.mp4%20%28240p%29.mp4?loc=external&oauth2_token_id=1223210874&signature=572b3db38a6c7a42b636ad8c6bc653e1e38103a6af089cd72900389d4649a3b2" type="video/mp4"
poster="https://thumbs.wbm.im/pw/medium/6ab006dd8a6d7323de4bfd1098f6b88f.jpg"/>
Your browser does not support the video tag.
</video>
<p style="font-size: 12px; margin: 0;">PikWizard</p>
</a>
</span>
</span>
Free (free of charge)
Free for personal and commercial use.
Author: Awesome Content