
- Home >
- Stock Videos >
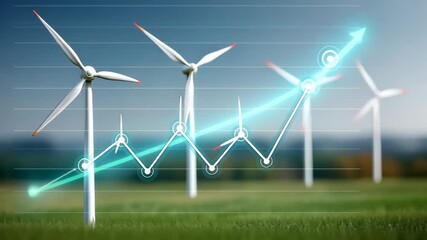
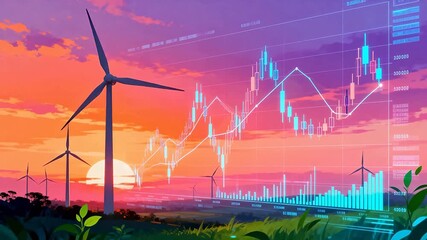
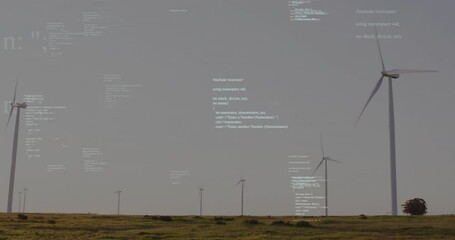
- Renewable Energy Data Visualization with Graphs and Charts
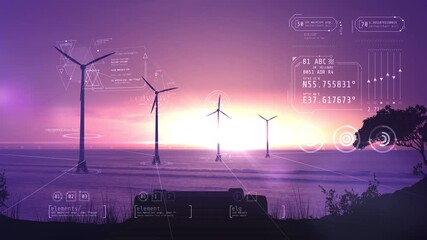
Renewable Energy Data Visualization with Graphs and Charts Video
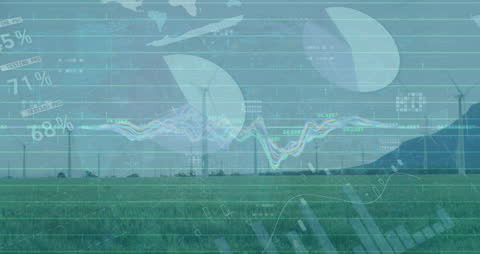
This illustration embodies the integration of renewable energy data with digital technology, depicting wind turbines alongside charts and graphs. The video can be utilized for presentations and content focusing on sustainable technology, clean energy advancements, or data-driven insights in the environment sector. Ideal for educational materials, financial reports on green technology investments, or marketing campaigns for sustainable innovations.
Powered by 


downloads
Tags:
More
Credit Photo
If you would like to credit the Photo, here are some ways you can do so
Text Link
video Link
<span class="text-link">
<span>
<a target="_blank" href=https://pikwizard.com/video/renewable-energy-data-visualization-with-graphs-and-charts/b3288a0e8594a0d66ab1c44934282f95/>PikWizard</a>
</span>
</span>
<span class="image-link">
<span
style="margin: 0 0 20px 0; display: inline-block; vertical-align: middle; width: 100%;"
>
<a
target="_blank"
href="https://pikwizard.com/video/renewable-energy-data-visualization-with-graphs-and-charts/b3288a0e8594a0d66ab1c44934282f95/"
style="text-decoration: none; font-size: 10px; margin: 0;"
>
<video controls style="width: 100%; margin: 0;">
<source src="https://player.vimeo.com/progressive_redirect/playback/759120727/rendition/240p/file.mp4?loc=external&oauth2_token_id=1223210874&signature=d49ef1b85dd90b5a63a3bd8b62b3a723b49d330ee67eb587085ee728b3f8c0b3" type="video/mp4"
poster="https://pikwizard.com/pw/medium/b3288a0e8594a0d66ab1c44934282f95.jpg"/>
Your browser does not support the video tag.
</video>
<p style="font-size: 12px; margin: 0;">PikWizard</p>
</a>
</span>
</span>
Free (free of charge)
Free for personal and commercial use.
Author: Awesome Content