
- Home >
- Stock Videos >
- Renewable Energy Statistics Overlaid on Power Lines Grid
Renewable Energy Statistics Overlaid on Power Lines Grid Video
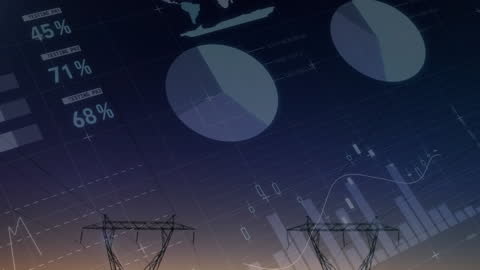
Picturing a dynamic mix of financial data with pie charts and graphs overlays intersecting high voltage lines suggests the interconnectedness of energy infrastructure and global markets. Ideal for topics on renewable energy trends, data analytics in utility sectors, or global economic connections. Could be utilized in presentations or publications on technology in energy, growth trends, or infrastructure innovation.
Powered by 


2
downloads
downloads
Tags:
More
Credit Photo
If you would like to credit the Photo, here are some ways you can do so
Text Link
video Link
<span class="text-link">
<span>
<a target="_blank" href=https://pikwizard.com/video/renewable-energy-statistics-overlaid-on-power-lines-grid/9f584b78a9893e8035a816fa871a98c0/>PikWizard</a>
</span>
</span>
<span class="image-link">
<span
style="margin: 0 0 20px 0; display: inline-block; vertical-align: middle; width: 100%;"
>
<a
target="_blank"
href="https://pikwizard.com/video/renewable-energy-statistics-overlaid-on-power-lines-grid/9f584b78a9893e8035a816fa871a98c0/"
style="text-decoration: none; font-size: 10px; margin: 0;"
>
<video controls style="width: 100%; margin: 0;">
<source src="https://player.vimeo.com/progressive_redirect/playback/717066660/rendition/240p/file.mp4?loc=external&oauth2_token_id=1223210874&signature=3b5f43dc66954c87ed030f804551b4fe3c0127c2a9139f1ad9308aa6648fdbe8" type="video/mp4"
poster="https://pikwizard.com/pw/medium/9f584b78a9893e8035a816fa871a98c0.jpg"/>
Your browser does not support the video tag.
</video>
<p style="font-size: 12px; margin: 0;">PikWizard</p>
</a>
</span>
</span>
Free (free of charge)
Free for personal and commercial use.
Author: Awesome Content