
- Home >
- Stock Videos >
- Renewable Energy Statistics with Declining Graph
Renewable Energy Statistics with Declining Graph Video
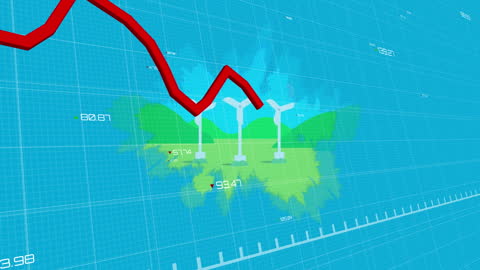
A digital representation of renewable energy statistics is visualized with a backdrop of wind turbines and a prominent red line graph indicating negative business or environmental data trends. Ideal for use in presentations related to sustainability challenges, business analytics of green energy markets, and environmental impact assessments. This illustration captures the intersection of technology and environmental data representation.

downloads
Tags:
More
Credit Photo
If you would like to credit the Photo, here are some ways you can do so
Text Link
video Link
<span class="text-link">
<span>
<a target="_blank" href=https://pikwizard.com/video/renewable-energy-statistics-with-declining-graph/7eae367fda8138572f173716d7c656ed/>PikWizard</a>
</span>
</span>
<span class="image-link">
<span
style="margin: 0 0 20px 0; display: inline-block; vertical-align: middle; width: 100%;"
>
<a
target="_blank"
href="https://pikwizard.com/video/renewable-energy-statistics-with-declining-graph/7eae367fda8138572f173716d7c656ed/"
style="text-decoration: none; font-size: 10px; margin: 0;"
>
<video controls style="width: 100%; margin: 0;">
<source src="https://player.vimeo.com/progressive_redirect/playback/717213196/rendition/240p/file.mp4?loc=external&oauth2_token_id=1223210874&signature=a9eee5433fec099ea1bdc98974b548671299c8bc947e5c91be2aca4db5e36cc6" type="video/mp4"
poster="https://pikwizard.com/pw/medium/7eae367fda8138572f173716d7c656ed.jpg"/>
Your browser does not support the video tag.
</video>
<p style="font-size: 12px; margin: 0;">PikWizard</p>
</a>
</span>
</span>
Free (free of charge)
Free for personal and commercial use.
Author: Awesome Content