
- Home >
- Stock Videos >
- Soccer Ball Overlayed with Dynamic Performance Analysis Chart
Soccer Ball Overlayed with Dynamic Performance Analysis Chart Video
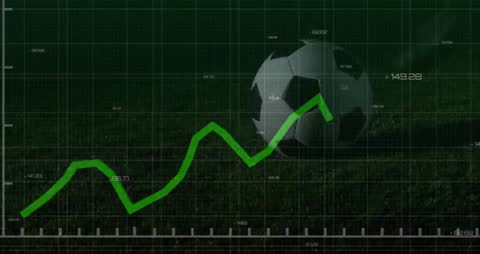
This visual depicts a soccer ball behind an upward trending digital chart, symbolizing the use of data analytics in sports to track or enhance performance. The graph illustrates spikes and dips, similar to market charts but applied to soccer analytics. Perfect for presentations or websites focusing on sports data analysis, coaching strategy development, game performance reviews, broadcasting sports insights, and integrating technology in athletics.
Powered by 


downloads
Tags:
More
Credit Photo
If you would like to credit the Photo, here are some ways you can do so
Text Link
video Link
<span class="text-link">
<span>
<a target="_blank" href=https://pikwizard.com/video/soccer-ball-overlayed-with-dynamic-performance-analysis-chart/314c3d253ff23b8f2c702dd619060a78/>PikWizard</a>
</span>
</span>
<span class="image-link">
<span
style="margin: 0 0 20px 0; display: inline-block; vertical-align: middle; width: 100%;"
>
<a
target="_blank"
href="https://pikwizard.com/video/soccer-ball-overlayed-with-dynamic-performance-analysis-chart/314c3d253ff23b8f2c702dd619060a78/"
style="text-decoration: none; font-size: 10px; margin: 0;"
>
<video controls style="width: 100%; margin: 0;">
<source src="https://player.vimeo.com/progressive_redirect/playback/1091964272/rendition/240p/file.mp4?loc=external&oauth2_token_id=1223210874&signature=8b08092761ea00b7a13761c2f62048fca55c7937a9cdbc04ea6bb1aa7bc910ac" type="video/mp4"
poster="https://pikwizard.com/pw/medium/314c3d253ff23b8f2c702dd619060a78.jpg"/>
Your browser does not support the video tag.
</video>
<p style="font-size: 12px; margin: 0;">PikWizard</p>
</a>
</span>
</span>
Free (free of charge)
Free for personal and commercial use.
Author: Awesome Content