
- Home >
- Stock Videos >
- Spinning Globe with Stock Market Data Processing Visual
Spinning Globe with Stock Market Data Processing Visual Video
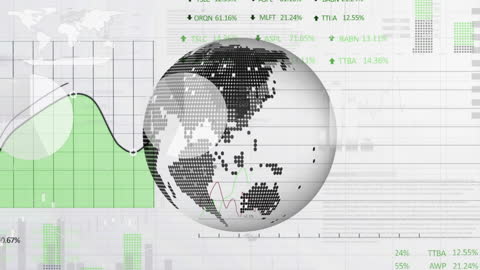
This visual of a spinning globe with overlayed stock market data represents global financial analytics and the concept of international business trends. Ideal for use in presentations on global economy, finance technology solutions, or engaging content for business and financial websites that focus on worldwide market analysis.
Powered by  - Get 15% off with code: PIKWIZARD15


downloads
Tags:
More
Credit Photo
If you would like to credit the Photo, here are some ways you can do so
Text Link
video Link
<span class="text-link">
<span>
<a target="_blank" href=https://pikwizard.com/video/spinning-globe-with-stock-market-data-processing-visual/ab574133da76979334639e20e37816a2/>PikWizard</a>
</span>
</span>
<span class="image-link">
<span
style="margin: 0 0 20px 0; display: inline-block; vertical-align: middle; width: 100%;"
>
<a
target="_blank"
href="https://pikwizard.com/video/spinning-globe-with-stock-market-data-processing-visual/ab574133da76979334639e20e37816a2/"
style="text-decoration: none; font-size: 10px; margin: 0;"
>
<video controls style="width: 100%; margin: 0;">
<source src="https://player.vimeo.com/progressive_redirect/playback/826415432/rendition/240p/file.mp4?loc=external&oauth2_token_id=1223210874&signature=96d2f5a249a7836fa41f95816090d7733181275be562785fd619ce7e325ddfcb" type="video/mp4"
poster="https://pikwizard.com/pw/medium/ab574133da76979334639e20e37816a2.jpg"/>
Your browser does not support the video tag.
</video>
<p style="font-size: 12px; margin: 0;">PikWizard</p>
</a>
</span>
</span>
Free (free of charge)
Free for personal and commercial use.
Author: Awesome Content