
- Home >
- Stock Videos >
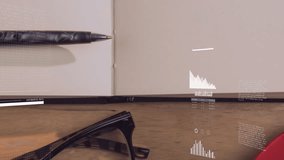
- Statistical Data Graph Overlay on Office Desk
Statistical Data Graph Overlay on Office Desk Video

Statistical data graphs overlay office equipment like a laptop and camera on a close wooden desk surface, conveying themes of business and technology. The overlay of growth charts represents concepts of financial analysis, data processing, and modern business environments. Suitable for illustrating finance blogs, scientific research articles, and technological industry reports.
Powered by  - Get 15% off with code: PIKWIZARD15


downloads
Tags:
More
Credit Photo
If you would like to credit the Photo, here are some ways you can do so
Text Link
video Link
<span class="text-link">
<span>
<a target="_blank" href=https://pikwizard.com/video/statistical-data-graph-overlay-on-office-desk/797cbfeb8a29586c8caf8a098cd28e01/>PikWizard</a>
</span>
</span>
<span class="image-link">
<span
style="margin: 0 0 20px 0; display: inline-block; vertical-align: middle; width: 100%;"
>
<a
target="_blank"
href="https://pikwizard.com/video/statistical-data-graph-overlay-on-office-desk/797cbfeb8a29586c8caf8a098cd28e01/"
style="text-decoration: none; font-size: 10px; margin: 0;"
>
<video controls style="width: 100%; margin: 0;">
<source src="https://player.vimeo.com/progressive_redirect/playback/798311617/rendition/240p/file.mp4?loc=external&oauth2_token_id=1223210874&signature=e2d5b2b4da8491e45e6511af6df06b49c7abf5bd954d55e31988b572b0e2919d" type="video/mp4"
poster="https://pikwizard.com/pw/medium/797cbfeb8a29586c8caf8a098cd28e01.jpg"/>
Your browser does not support the video tag.
</video>
<p style="font-size: 12px; margin: 0;">PikWizard</p>
</a>
</span>
</span>
Free (free of charge)
Free for personal and commercial use.
Author: Awesome Content