
- Home >
- Stock Videos >
- Stock Market Data and Analytical Bar Graphs on Digital Display
Stock Market Data and Analytical Bar Graphs on Digital Display Video
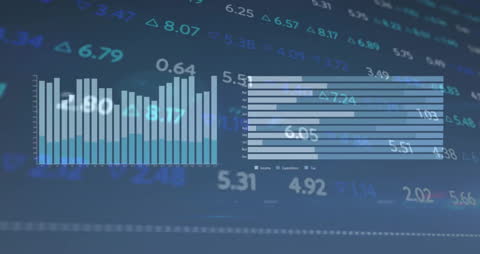
Animation illustrates financial data processing with analytical bar graphs on digital display. Useful for depicting financial presentations, business reviews, economic analysis, stock market features, or fintech app development.
Powered by  - Get 15% off with code: PIKWIZARD15


1
downloads
downloads
Tags:
More
Credit Photo
If you would like to credit the Photo, here are some ways you can do so
Text Link
video Link
<span class="text-link">
<span>
<a target="_blank" href=https://pikwizard.com/video/stock-market-data-and-analytical-bar-graphs-on-digital-display/6611deff5c052c8fad4054687ccf4ec2/>PikWizard</a>
</span>
</span>
<span class="image-link">
<span
style="margin: 0 0 20px 0; display: inline-block; vertical-align: middle; width: 100%;"
>
<a
target="_blank"
href="https://pikwizard.com/video/stock-market-data-and-analytical-bar-graphs-on-digital-display/6611deff5c052c8fad4054687ccf4ec2/"
style="text-decoration: none; font-size: 10px; margin: 0;"
>
<video controls style="width: 100%; margin: 0;">
<source src="https://player.vimeo.com/progressive_redirect/playback/881636763/rendition/240p/file.mp4?loc=external&oauth2_token_id=1223210874&signature=b4b4ee3467268b4131d04473503e2d64959745aa9cc6addd13a21c2c5c3ceafe" type="video/mp4"
poster="https://pikwizard.com/pw/medium/6611deff5c052c8fad4054687ccf4ec2.jpg"/>
Your browser does not support the video tag.
</video>
<p style="font-size: 12px; margin: 0;">PikWizard</p>
</a>
</span>
</span>
Free (free of charge)
Free for personal and commercial use.
Author: Awesome Content