
- Home >
- Stock Videos >
- Stock Market Data Animation with Digital Global Interface
Stock Market Data Animation with Digital Global Interface Video
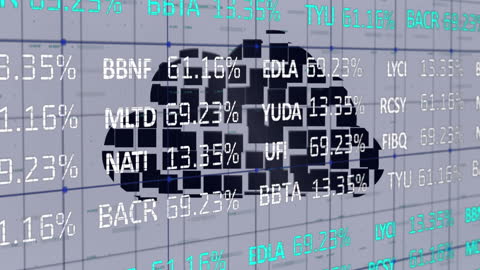
Abstract depiction of financial data processing in digital format, overlaying numerical statistics over a patterned grid background. Ideal for illustrating finance-driven content, economic analysis, business reports, or showcases related to stock market technology. Useful for presentations, reports, or visuals focused on global corporate communications and advanced data analysis systems.
Powered by 


downloads
Tags:
More
Credit Photo
If you would like to credit the Photo, here are some ways you can do so
Text Link
video Link
<span class="text-link">
<span>
<a target="_blank" href=https://pikwizard.com/video/stock-market-data-animation-with-digital-global-interface/0488feaa848d9ec007c2fe49f2bd2014/>PikWizard</a>
</span>
</span>
<span class="image-link">
<span
style="margin: 0 0 20px 0; display: inline-block; vertical-align: middle; width: 100%;"
>
<a
target="_blank"
href="https://pikwizard.com/video/stock-market-data-animation-with-digital-global-interface/0488feaa848d9ec007c2fe49f2bd2014/"
style="text-decoration: none; font-size: 10px; margin: 0;"
>
<video controls style="width: 100%; margin: 0;">
<source src="https://player.vimeo.com/progressive_redirect/playback/758926092/rendition/240p/file.mp4?loc=external&oauth2_token_id=1223210874&signature=8266a9b3378b52ff15754f190a585836f7c7b06efa528e259feb01c3491d6538" type="video/mp4"
poster="https://pikwizard.com/pw/medium/0488feaa848d9ec007c2fe49f2bd2014.jpg"/>
Your browser does not support the video tag.
</video>
<p style="font-size: 12px; margin: 0;">PikWizard</p>
</a>
</span>
</span>
Free (free of charge)
Free for personal and commercial use.
Author: Awesome Content