
- Home >
- Stock Videos >
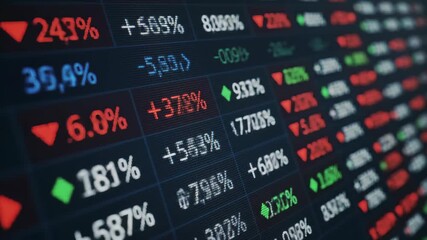
- Stock Market Data on Digital Screen Interface
Stock Market Data on Digital Screen Interface Video
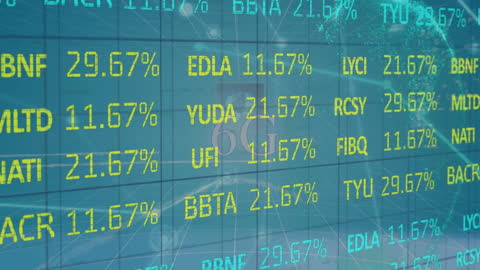
This high-resolution digital display shows real-time stock market data with fluctuating percentages and symbols. It is ideal for illustrating financial concepts, market analytics, international trading environments, and technology in finance industries. Perfect for use in business presentations, reports on financial trends, investment strategies, and articles about economic news.
Powered by 


downloads
Tags:
More
Credit Photo
If you would like to credit the Photo, here are some ways you can do so
Text Link
video Link
<span class="text-link">
<span>
<a target="_blank" href=https://pikwizard.com/video/stock-market-data-on-digital-screen-interface/654930bf3c291b0a3ef699ca045ec1e1/>PikWizard</a>
</span>
</span>
<span class="image-link">
<span
style="margin: 0 0 20px 0; display: inline-block; vertical-align: middle; width: 100%;"
>
<a
target="_blank"
href="https://pikwizard.com/video/stock-market-data-on-digital-screen-interface/654930bf3c291b0a3ef699ca045ec1e1/"
style="text-decoration: none; font-size: 10px; margin: 0;"
>
<video controls style="width: 100%; margin: 0;">
<source src="https://player.vimeo.com/progressive_redirect/playback/907534154/rendition/240p/file.mp4?loc=external&oauth2_token_id=1223210874&signature=5099d4f97a5c412b1cb29111b4a9a80a5ed9f2cb9406673e2d00b727fa0f2278" type="video/mp4"
poster="https://pikwizard.com/pw/medium/654930bf3c291b0a3ef699ca045ec1e1.jpg"/>
Your browser does not support the video tag.
</video>
<p style="font-size: 12px; margin: 0;">PikWizard</p>
</a>
</span>
</span>
Free (free of charge)
Free for personal and commercial use.
Author: Awesome Content