
- Home >
- Stock Videos >
- Stock Market Data Streaming on Financial Display Interface
Stock Market Data Streaming on Financial Display Interface Video
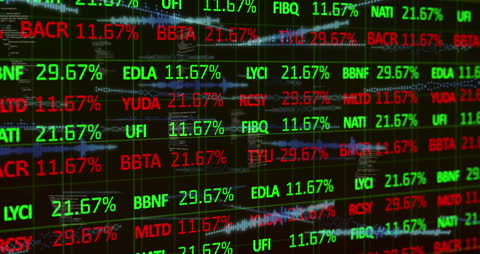
Visualizing streaming stock market data with numerical changes analyzed in a high-tech interface. Useful for illustrating themes of global finance, economic outlook, trading operations, and financial analysis in digital media and presentations.

downloads
Tags:
More
Credit Photo
If you would like to credit the Photo, here are some ways you can do so
Text Link
video Link
<span class="text-link">
<span>
<a target="_blank" href=https://pikwizard.com/video/stock-market-data-streaming-on-financial-display-interface/358feee0186ca00bfe45c945fe6ee302/>PikWizard</a>
</span>
</span>
<span class="image-link">
<span
style="margin: 0 0 20px 0; display: inline-block; vertical-align: middle; width: 100%;"
>
<a
target="_blank"
href="https://pikwizard.com/video/stock-market-data-streaming-on-financial-display-interface/358feee0186ca00bfe45c945fe6ee302/"
style="text-decoration: none; font-size: 10px; margin: 0;"
>
<video controls style="width: 100%; margin: 0;">
<source src="https://player.vimeo.com/progressive_redirect/playback/759954644/rendition/240p/file.mp4?loc=external&oauth2_token_id=1223210874&signature=988d33d70a812bfec6b64c71f29999718fbc4100b76fc20195bc6be9d424b75d" type="video/mp4"
poster="https://pikwizard.com/pw/medium/358feee0186ca00bfe45c945fe6ee302.jpg"/>
Your browser does not support the video tag.
</video>
<p style="font-size: 12px; margin: 0;">PikWizard</p>
</a>
</span>
</span>
Free (free of charge)
Free for personal and commercial use.
Author: Awesome Content