
- Home >
- Stock Videos >
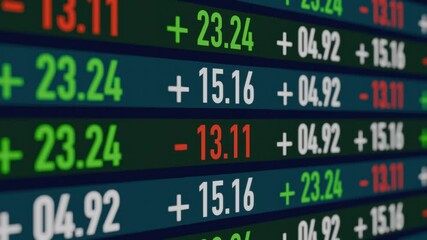
- Stock Market Data Visualization with Graphs and Charts
Stock Market Data Visualization with Graphs and Charts Video
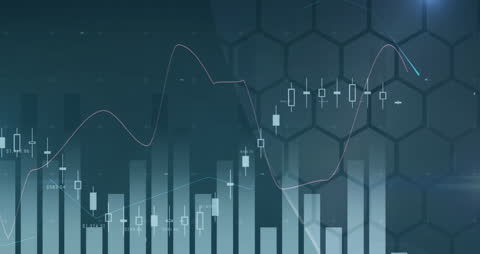
Real-time financial data takes center stage here with overlapping graphs, candlestick charts, and fluctuating numerical readouts. Perfect for illustrating articles and content about stock market trends, investment analysis, financial technology and digital finance.
Powered by 


downloads
Tags:
More
Credit Photo
If you would like to credit the Photo, here are some ways you can do so
Text Link
video Link
<span class="text-link">
<span>
<a target="_blank" href=https://pikwizard.com/video/stock-market-data-visualization-with-graphs-and-charts/461d25f9e747b4fc06d905ef5417da6c/>PikWizard</a>
</span>
</span>
<span class="image-link">
<span
style="margin: 0 0 20px 0; display: inline-block; vertical-align: middle; width: 100%;"
>
<a
target="_blank"
href="https://pikwizard.com/video/stock-market-data-visualization-with-graphs-and-charts/461d25f9e747b4fc06d905ef5417da6c/"
style="text-decoration: none; font-size: 10px; margin: 0;"
>
<video controls style="width: 100%; margin: 0;">
<source src="https://player.vimeo.com/progressive_redirect/playback/901429765/rendition/240p/file.mp4?loc=external&oauth2_token_id=1223210874&signature=4ca99d4923843a1782b2e915679f1a490ff95ee84ca69543173c90eeea559d6b" type="video/mp4"
poster="https://pikwizard.com/pw/medium/461d25f9e747b4fc06d905ef5417da6c.jpg"/>
Your browser does not support the video tag.
</video>
<p style="font-size: 12px; margin: 0;">PikWizard</p>
</a>
</span>
</span>
Free (free of charge)
Free for personal and commercial use.
Author: Awesome Content
Similar Free Stock Videos
Loading...