
- Home >
- Stock Videos >
- Stock Market Index Displaying Dynamic Data Visualization
Stock Market Index Displaying Dynamic Data Visualization Video
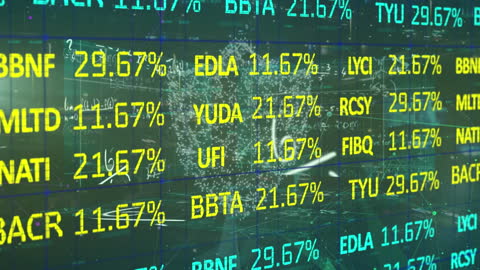
The video shows stock market ticker numbers projected over a blurred cityscape, featuring dynamic and vibrant data visualizations. This representation captures the essence of global business, indicating a fast-paced economic environment. It can be useful for projects related to finance, technology development, financial analytics programs, or presentations highlighting growth opportunities and market trends.
Powered by 


downloads
Tags:
More
Credit Photo
If you would like to credit the Photo, here are some ways you can do so
Text Link
video Link
<span class="text-link">
<span>
<a target="_blank" href=https://pikwizard.com/video/stock-market-index-displaying-dynamic-data-visualization/fd22b4f038478de04ce20a1b91c51b16/>PikWizard</a>
</span>
</span>
<span class="image-link">
<span
style="margin: 0 0 20px 0; display: inline-block; vertical-align: middle; width: 100%;"
>
<a
target="_blank"
href="https://pikwizard.com/video/stock-market-index-displaying-dynamic-data-visualization/fd22b4f038478de04ce20a1b91c51b16/"
style="text-decoration: none; font-size: 10px; margin: 0;"
>
<video controls style="width: 100%; margin: 0;">
<source src="https://player.vimeo.com/progressive_redirect/playback/764602367/rendition/240p/file.mp4?loc=external&oauth2_token_id=1223210874&signature=d110d75285f35a72342f6ef515af1bdd0a81281b8b455acb07cbf83acc346927" type="video/mp4"
poster="https://pikwizard.com/pw/medium/fd22b4f038478de04ce20a1b91c51b16.jpg"/>
Your browser does not support the video tag.
</video>
<p style="font-size: 12px; margin: 0;">PikWizard</p>
</a>
</span>
</span>
Free (free of charge)
Free for personal and commercial use.
Author: Awesome Content