
- Home >
- Stock Videos >
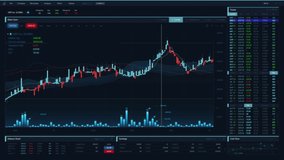
- Stock Market Trading Screen with Various Charts and Data Visualizations
Stock Market Trading Screen with Various Charts and Data Visualizations Video

AI Generated Image. Visual of a professional trading desk screen filling display with data charts and graphics showing stock information, percentage changes indicating various market trends. Useful for depicting dynamic financial environments in presentations about investing, finance technology, market analysis, and economic reports.
Powered by  - Get 15% off with code: PIKWIZARD15


0
downloads
downloads
Tags:
More
Credit Photo
If you would like to credit the Photo, here are some ways you can do so
Text Link
video Link
<span class="text-link">
<span>
<a target="_blank" href=https://pikwizard.com/video/stock-market-trading-screen-with-various-charts-and-data-visualizations/9c7e79707b839df6ccf21fcd83e1e7a0/>PikWizard</a>
</span>
</span>
<span class="image-link">
<span
style="margin: 0 0 20px 0; display: inline-block; vertical-align: middle; width: 100%;"
>
<a
target="_blank"
href="https://pikwizard.com/video/stock-market-trading-screen-with-various-charts-and-data-visualizations/9c7e79707b839df6ccf21fcd83e1e7a0/"
style="text-decoration: none; font-size: 10px; margin: 0;"
>
<video controls style="width: 100%; margin: 0;">
<source src="https://player.vimeo.com/progressive_redirect/playback/1097860652/rendition/240p/file.mp4?loc=external&oauth2_token_id=1223210874&signature=a00f98477ff37495ea6e7d2b25142b8a8ff94bb6eef14759d29daa16ac340a9a" type="video/mp4"
poster="https://pikwizard.com/pw/medium/9c7e79707b839df6ccf21fcd83e1e7a0.jpg"/>
Your browser does not support the video tag.
</video>
<p style="font-size: 12px; margin: 0;">PikWizard</p>
</a>
</span>
</span>
Free (free of charge)
Free for personal and commercial use.
Author: AI Creator