
- Home >
- Stock Videos >
- Sustainability Data Visualization Over Port Cityscape
Sustainability Data Visualization Over Port Cityscape Video
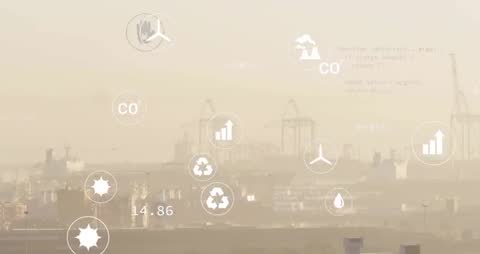
Conceptual representation of pollution tracking indicators overlaying a port's industrial landscape, showcasing technology-driven environmental observation. Useful for illustrating topics on sustainability, urbanization, industrial impact on nature, and environmental monitoring technologies. Ideal for presentations or articles on environmental science, urban development, or technological advancements in tracking ecological data.
Powered by 


downloads
Tags:
More
Credit Photo
If you would like to credit the Photo, here are some ways you can do so
Text Link
video Link
<span class="text-link">
<span>
<a target="_blank" href=https://pikwizard.com/video/sustainability-data-visualization-over-port-cityscape/b82427f405270119c3bf4bffdb5716cf/>PikWizard</a>
</span>
</span>
<span class="image-link">
<span
style="margin: 0 0 20px 0; display: inline-block; vertical-align: middle; width: 100%;"
>
<a
target="_blank"
href="https://pikwizard.com/video/sustainability-data-visualization-over-port-cityscape/b82427f405270119c3bf4bffdb5716cf/"
style="text-decoration: none; font-size: 10px; margin: 0;"
>
<video controls style="width: 100%; margin: 0;">
<source src="https://player.vimeo.com/progressive_redirect/playback/1094225273/rendition/240p/file.mp4?loc=external&oauth2_token_id=1223210874&signature=ac1a58614642e71074450a5a7785a8bb311278a1860eafd2ff567984125fd7e4" type="video/mp4"
poster="https://pikwizard.com/pw/medium/b82427f405270119c3bf4bffdb5716cf.jpg"/>
Your browser does not support the video tag.
</video>
<p style="font-size: 12px; margin: 0;">PikWizard</p>
</a>
</span>
</span>
Free (free of charge)
Free for personal and commercial use.
Author: Awesome Content