
- Home >
- Stock Videos >
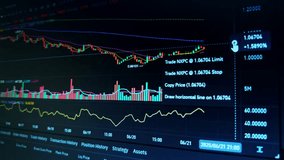
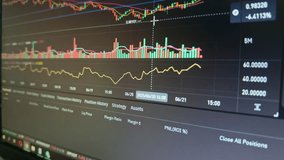
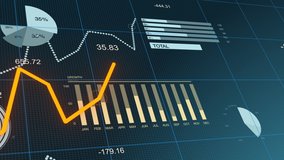
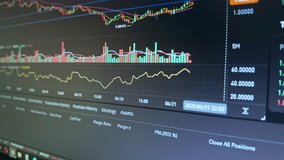
- Time-Driven Financial Analysis With Animated Charts
Time-Driven Financial Analysis With Animated Charts Video

Visualization depicting integration of time and economic data, ideal for illustrating market analyses nationally or globally. Useful for projects focusing on the importance of time in financial strategies, financial technology, or stock market presentations.
Powered by  - Get 15% off with code: PIKWIZARD15


downloads
Tags:
More
Credit Photo
If you would like to credit the Photo, here are some ways you can do so
Text Link
video Link
<span class="text-link">
<span>
<a target="_blank" href=https://pikwizard.com/video/time-driven-financial-analysis-with-animated-charts/e12cf06247f155ce82f62639f3e99c3c/>PikWizard</a>
</span>
</span>
<span class="image-link">
<span
style="margin: 0 0 20px 0; display: inline-block; vertical-align: middle; width: 100%;"
>
<a
target="_blank"
href="https://pikwizard.com/video/time-driven-financial-analysis-with-animated-charts/e12cf06247f155ce82f62639f3e99c3c/"
style="text-decoration: none; font-size: 10px; margin: 0;"
>
<video controls style="width: 100%; margin: 0;">
<source src="https://player.vimeo.com/progressive_redirect/playback/716906432/rendition/240p/file.mp4?loc=external&oauth2_token_id=1223210874&signature=d496f5914a305e038f4d63a36aa900350d847676e79c00d6618d451d08861195" type="video/mp4"
poster="https://pikwizard.com/pw/medium/e12cf06247f155ce82f62639f3e99c3c.jpg"/>
Your browser does not support the video tag.
</video>
<p style="font-size: 12px; margin: 0;">PikWizard</p>
</a>
</span>
</span>
Free (free of charge)
Free for personal and commercial use.
Author: Awesome Content