
- Home >
- Stock Videos >
- Time for Change Message with Data Visualization
Time for Change Message with Data Visualization Video
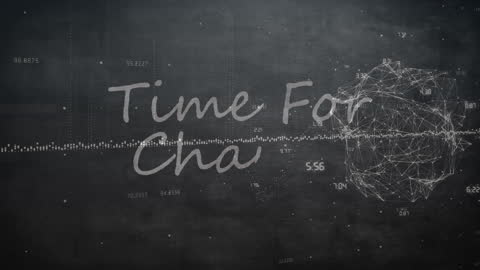
Visual representation of time for change showing spinning globe and data processing with white line graph. Ideal for topics on innovation, change, technological advancements, and digital transformations.

downloads
Tags:
More
Credit Photo
If you would like to credit the Photo, here are some ways you can do so
Text Link
video Link
<span class="text-link">
<span>
<a target="_blank" href=https://pikwizard.com/video/time-for-change-message-with-data-visualization/f440d580f05eec402ea496e301cac046/>PikWizard</a>
</span>
</span>
<span class="image-link">
<span
style="margin: 0 0 20px 0; display: inline-block; vertical-align: middle; width: 100%;"
>
<a
target="_blank"
href="https://pikwizard.com/video/time-for-change-message-with-data-visualization/f440d580f05eec402ea496e301cac046/"
style="text-decoration: none; font-size: 10px; margin: 0;"
>
<video controls style="width: 100%; margin: 0;">
<source src="https://player.vimeo.com/progressive_redirect/playback/762825760/rendition/240p/file.mp4?loc=external&oauth2_token_id=1223210874&signature=0373658a6a998a83ffe7b1168b83de85da651633c2cc4bbe5b93894bbd8a4602" type="video/mp4"
poster="https://pikwizard.com/pw/medium/f440d580f05eec402ea496e301cac046.jpg"/>
Your browser does not support the video tag.
</video>
<p style="font-size: 12px; margin: 0;">PikWizard</p>
</a>
</span>
</span>
Free (free of charge)
Free for personal and commercial use.
Author: Awesome Content