
- Home >
- Stock Videos >
- Time Management in Financial Data Analysis
Time Management in Financial Data Analysis Video

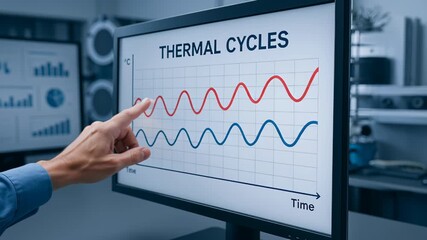
Abstract representation of time management in financial data analysis shows digital clock overlaying a line graph. Useful for illustrating concepts in financial technology, business strategy, and data-driven decision making. Suitable for financial reports, presentations on data analysis, or articles discussing economic trends and efficient time utilization.
Powered by 


downloads
Tags:
More
Credit Photo
If you would like to credit the Photo, here are some ways you can do so
Text Link
video Link
<span class="text-link">
<span>
<a target="_blank" href=https://pikwizard.com/video/time-management-in-financial-data-analysis/5a69c8d0b5a7323d21279745385ce13a/>PikWizard</a>
</span>
</span>
<span class="image-link">
<span
style="margin: 0 0 20px 0; display: inline-block; vertical-align: middle; width: 100%;"
>
<a
target="_blank"
href="https://pikwizard.com/video/time-management-in-financial-data-analysis/5a69c8d0b5a7323d21279745385ce13a/"
style="text-decoration: none; font-size: 10px; margin: 0;"
>
<video controls style="width: 100%; margin: 0;">
<source src="https://player.vimeo.com/progressive_redirect/playback/718989429/rendition/240p/file.mp4?loc=external&oauth2_token_id=1223210874&signature=fa4fcfa189b342b23ecca0adb49792df53cd017a3765688b99ff7fabe7dfc703" type="video/mp4"
poster="https://pikwizard.com/pw/medium/5a69c8d0b5a7323d21279745385ce13a.jpg"/>
Your browser does not support the video tag.
</video>
<p style="font-size: 12px; margin: 0;">PikWizard</p>
</a>
</span>
</span>
Free (free of charge)
Free for personal and commercial use.
Author: Awesome Content