
- Home >
- Stock Videos >
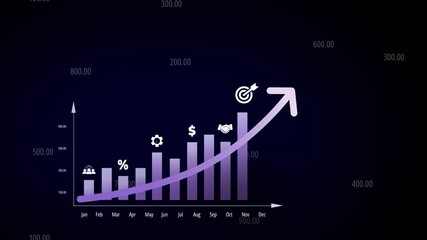
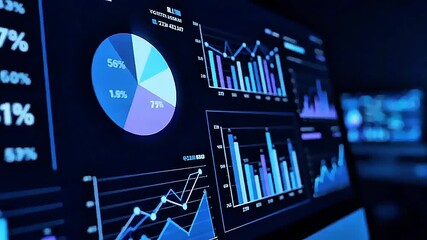
- Trade Show Graphs and Digital Financial Analysis
Trade Show Graphs and Digital Financial Analysis Video
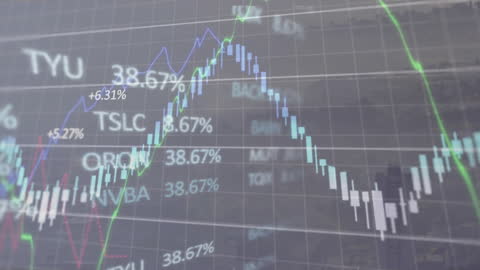
Visualizing stock market trends with financial graphs overlaid digitally is perfect for showcasing progress or setbacks in trades and investments related to stocks, the market, business analysis, economies, financial edu.
Powered by 


downloads
Tags:
More
Credit Photo
If you would like to credit the Photo, here are some ways you can do so
Text Link
video Link
<span class="text-link">
<span>
<a target="_blank" href=https://pikwizard.com/video/trade-show-graphs-and-digital-financial-analysis/f4c03cd94268cf689ab0eae9ca6aecf8/>PikWizard</a>
</span>
</span>
<span class="image-link">
<span
style="margin: 0 0 20px 0; display: inline-block; vertical-align: middle; width: 100%;"
>
<a
target="_blank"
href="https://pikwizard.com/video/trade-show-graphs-and-digital-financial-analysis/f4c03cd94268cf689ab0eae9ca6aecf8/"
style="text-decoration: none; font-size: 10px; margin: 0;"
>
<video controls style="width: 100%; margin: 0;">
<source src="https://player.vimeo.com/progressive_redirect/playback/798426654/rendition/240p/file.mp4?loc=external&oauth2_token_id=1223210874&signature=151e1d32e05d3f05e011e278c4a9b4837b67f3ccc1f6a538b17ace21cf3e7465" type="video/mp4"
poster="https://pikwizard.com/pw/medium/f4c03cd94268cf689ab0eae9ca6aecf8.jpg"/>
Your browser does not support the video tag.
</video>
<p style="font-size: 12px; margin: 0;">PikWizard</p>
</a>
</span>
</span>
Free (free of charge)
Free for personal and commercial use.
Author: Awesome Content